Prompts for Work · Pack 7 · 10 prompt templates

Operations & Process
AI Prompt Templates

Ten prompts that take a process from the first map to the control plan. Every improvement starts from a measured baseline, every root cause ends in the process, and every supplier is chosen on total cost.

ChatGPT, Claude & Gemini Instant download No subscription Lifetime updates

Map, measure, improve, source, control

Run any prompt on its own, or run all ten in order. Each output feeds the next, building one Process Brief that the redesign, the supplier contract and the control plan all check against.

Four rules in every prompt

These are what stop the AI recommending changes on opinion instead of measured data.

Measure before you change

Every improvement starts from a dated baseline taken from real data. No gain is claimed without the before and after figure.

Fix the process, not the person

Every root cause ends at something in the process the company can change: a step, a rule, a handoff or a tool. “Human error” is where the analysis starts, not where it stops.

Total cost, not price

Suppliers and options are compared on total cost of ownership: price plus failures, rework, switching and the time spent managing them.

Every step has an owner and a standard

Each process step, measure and service level has one named owner, a measurable standard and a trigger for action.

One company, all ten prompts

Brennock distributes medical consumables to 1,900 clinics: $64M in revenue and about 26,000 orders a month. In March 2026 it switched couriers to save 9% on its $4.6M delivery bill. Within two quarters on-time delivery fell from 96% to 81%, 6.2% of orders were shipped wrong, Brennock had issued $1.1M in credits, and 4 of its top 50 clinics, worth $2.3M a year, had moved to a competitor. The returns process had never been written down. Here is how the ten prompts take Brennock from that failure to a redesigned process, a new courier contract and a control plan, one step at a time.*

96% → 81%

on-time delivery after the courier switch

6.2%

of orders shipped with the wrong item or quantity

$1.1M

in credits issued to clinics in two quarters

$2.3M

a year of revenue lost with 4 of the top 50 clinics

Step 1 · Map

Process Mapping: SIPOC & Value Stream Map

Maps the process as it runs today, step by step, and shows how much of the elapsed time is work and how much is waiting.

SIPOCValue stream mapValue-added time

What Brennock brought · COO

“Nobody can tell me where an order spends its two days.”

What the prompt returned

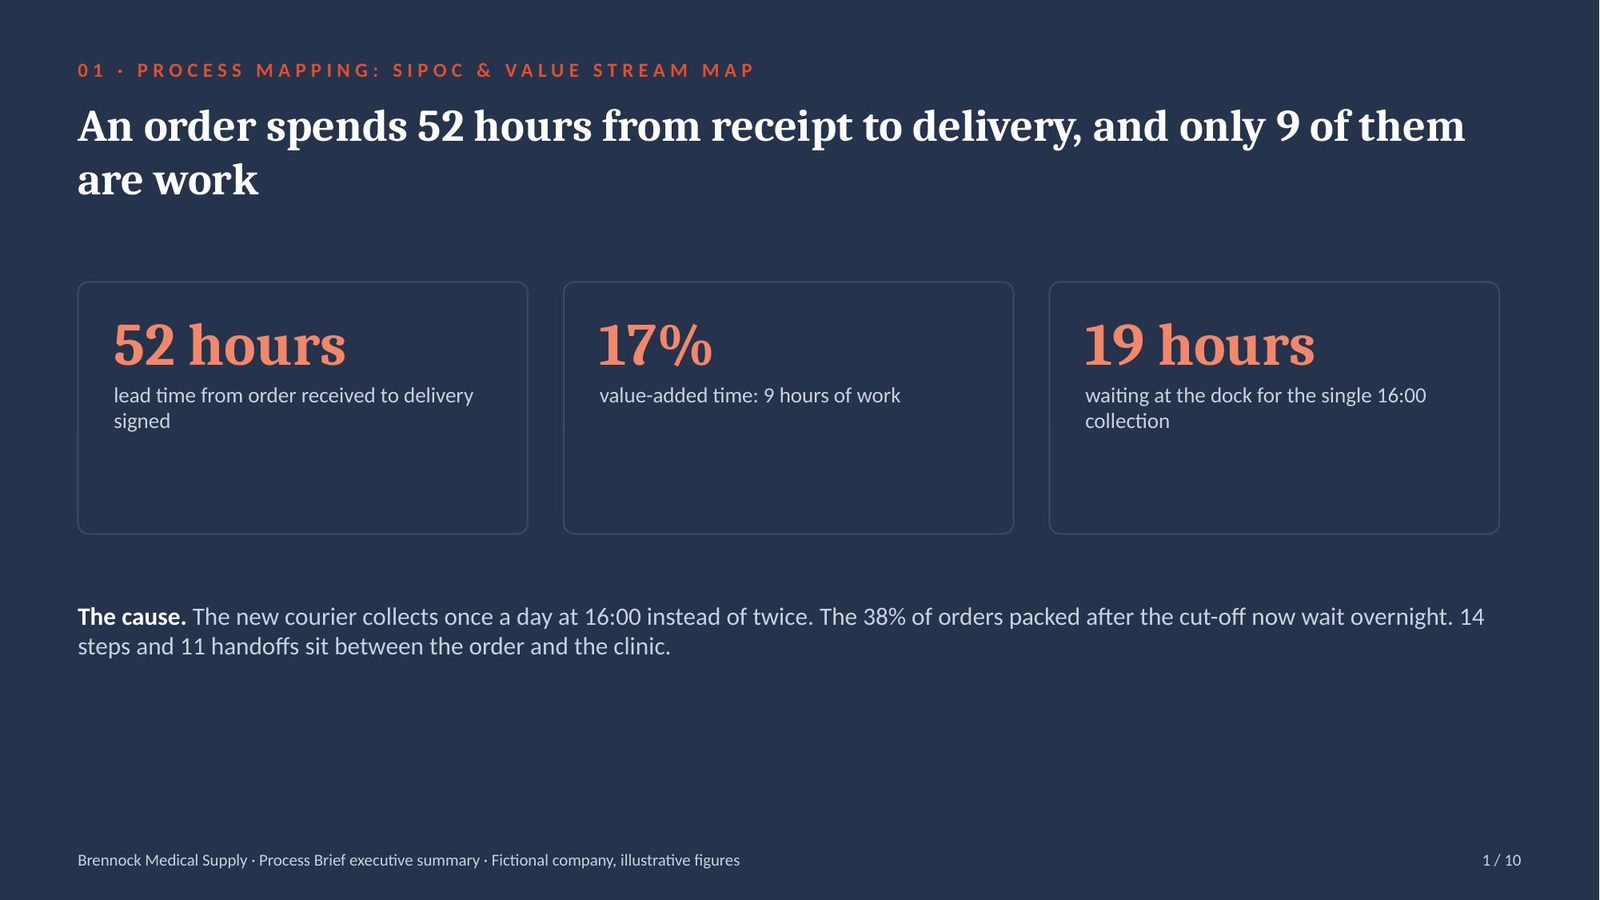
14 steps and 11 handoffs from order to delivery. Of 52 hours of lead time, 9 are work; the longest wait is 19 hours for the single 16:00 courier collection.

Steps14 steps, 11 handoffs across 4 teams and the courier
Work against wait9 hours of work in 52 hours of lead time: 17%
Longest wait19 hours between packing and the one daily collection
Causethe new courier collects once a day at 16:00, not twice

The analysis · 83% of an order’s time is spent waiting, most of it for one collection

A SIPOC lists the suppliers, inputs, process steps, outputs and customers of a process on one page. A value stream map adds the time each step takes and the time spent waiting before it, so the delay can be located.

  • 9 hours of work, 52 hours elapsed: value-added time is 17% of lead time. The other 43 hours are queues between steps, and that is where the delivery promise is lost.
  • 19 hours at the dock: the old courier collected at 11:00 and 16:00; the new one collects once, at 16:00. Orders packed after the cut-off, 38% of them, now wait overnight.
  • 11 handoffs: the order passes between customer service, the warehouse, quality and the courier eleven times, and address changes are keyed in twice.

Takeaway: measure the waiting time between steps, not only the work, and start with the 19-hour wait for the single courier collection.
Step 2 · Map

Standard Operating Procedure (SOP) & Work Instructions

Writes the procedure people follow: numbered steps, an owner and a standard for each, the checks, and what to do when something goes wrong.

SOPWork instructionsRACI

What Brennock brought · Head of Quality

“Returns are handled by four people in four different ways. Nothing is written down.”

What the prompt returned

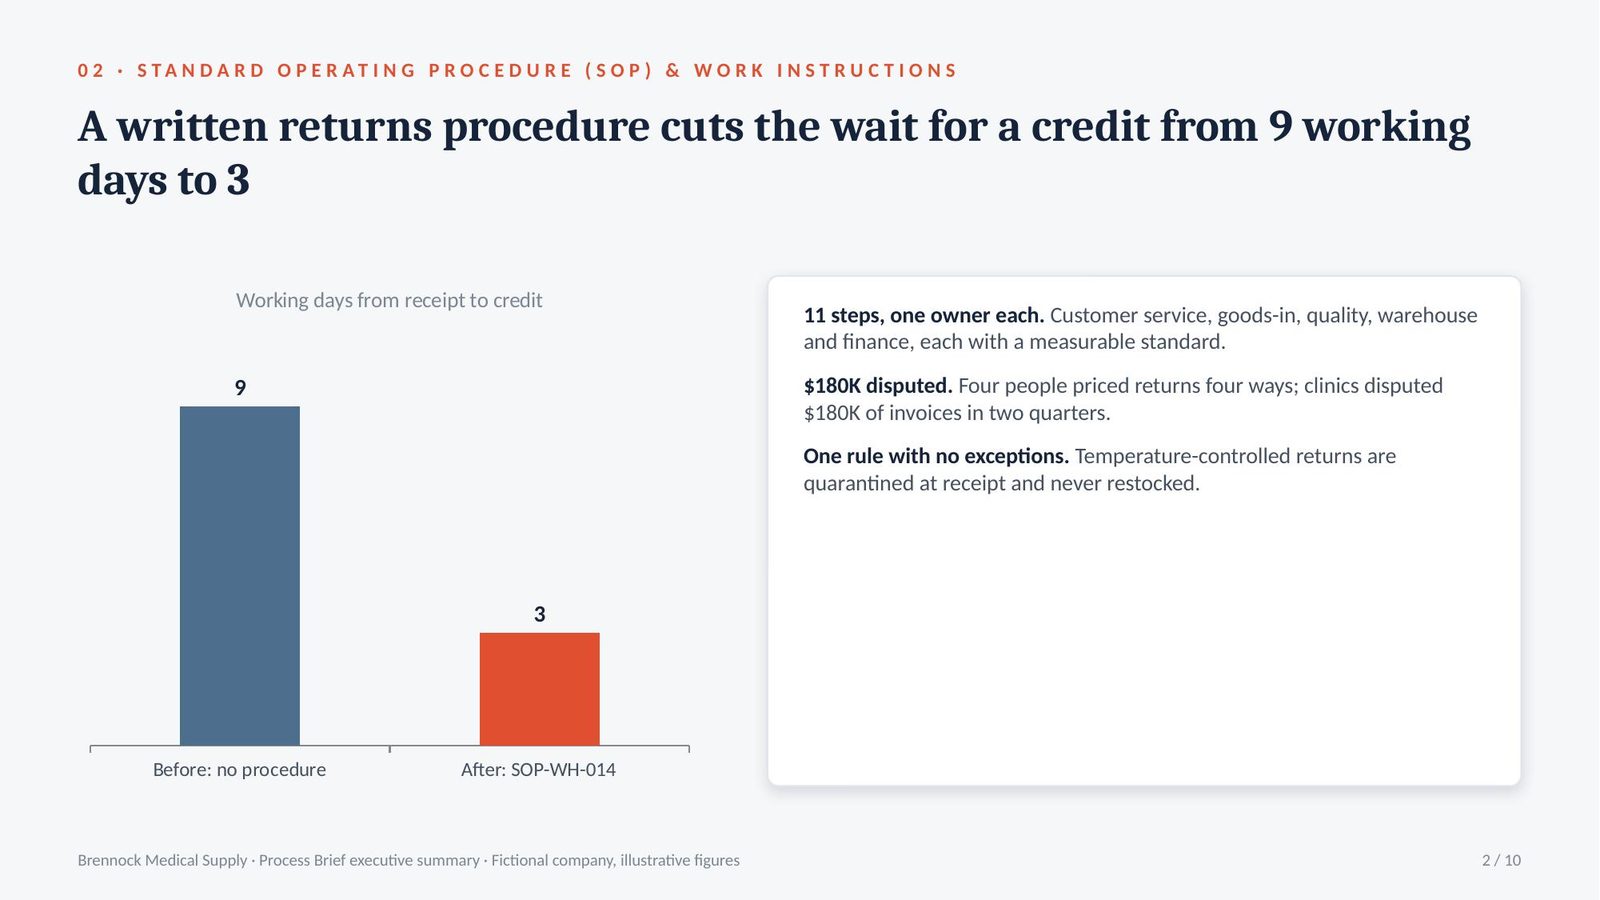
An 11-step returns procedure, each step with an owner and a standard. Credits issued within 3 working days, down from an average of 9.

Steps11 numbered steps, each with one owner
Check at receiptlot number and expiry date recorded before restocking
Exceptiontemperature-controlled items quarantined, never restocked
Standardcredit issued within 3 working days, from 9

The analysis · Four people handling returns four ways put $180K of invoices into dispute

A standard operating procedure (SOP) is the written, approved way a task is done, with numbered steps, owners and checks. A work instruction is the short version of the critical steps, used at the workstation.

  • 9 days to a credit: with no procedure, returns waited for whoever had time. Clinics waited an average of 9 working days for a credit and withheld payment in the meantime.
  • 1 credit in 5 was wrong: each person priced returns differently, and clinics disputed $180K of invoices in two quarters.
  • One exception with a safety cost: temperature-controlled items had been restocked after return. The procedure now quarantines them at receipt, with no exception.

Takeaway: write every step with one owner and a measurable standard, and give every exception a rule rather than leaving it to judgement.

Step 3 · Measure

Process Performance & Capacity Analysis

Measures cycle time, throughput and quality at each step, and finds the bottleneck that sets the output of the whole process.

Theory of ConstraintsFirst-pass yieldLittle’s Law

What Brennock brought · Warehouse Manager

“Every station is busy all day. I need more people everywhere.”

What the prompt returned

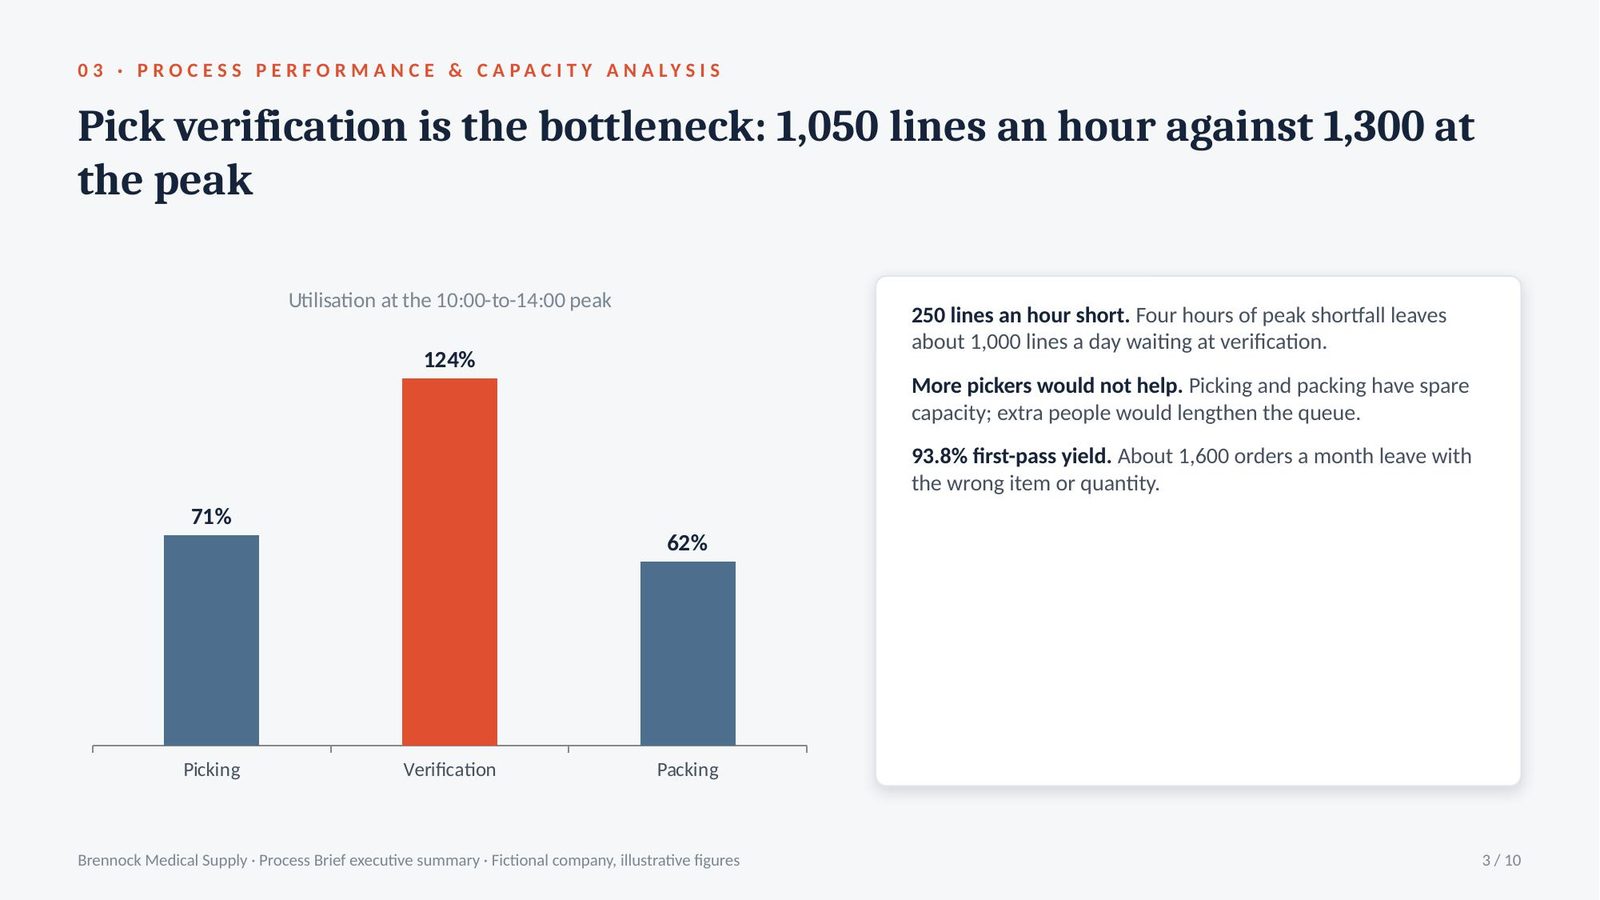
One station is the bottleneck: pick verification handles 1,050 lines an hour against 1,300 at the 10:00-to-14:00 peak. First-pass yield is 93.8%.

Bottleneckpick verification: 1,050 lines an hour against 1,300 at peak
Utilisation at peakpicking 71%, packing 62%, verification 124%
Queue createdabout 1,000 lines a day waiting, most of them missing the 16:00 collection
First-pass yield93.8%: 6.2% of orders need rework or a credit

The analysis · One station at 124% of capacity decides whether orders make the collection

The Theory of Constraints holds that the output of a process is set by its bottleneck, the step with the least capacity against demand. First-pass yield is the share of units completed correctly the first time, without rework.

  • 250 lines an hour short: verification handles 1,050 lines an hour; demand between 10:00 and 14:00 is 1,300. Four hours of shortfall leaves about 1,000 lines waiting each day.
  • More people everywhere would not help: picking runs at 71% and packing at 62% of capacity at the peak. Extra pickers would only lengthen the queue at verification.
  • 93.8% first-pass yield: 6.2% of 26,000 orders a month, about 1,600, leave with the wrong item or quantity. Most pass through verification during the peak.

Takeaway: add capacity only at the verification bottleneck, and only during the 10:00-to-14:00 peak.

Step 4 · Improve

Root Cause Analysis: Pareto, Fishbone & 5 Whys

Finds the few causes behind most failures, then traces each one to something in the process that can be changed.

Pareto analysisFishbone diagram5 Whys

What Brennock brought · Head of Quality

“It’s the new starters in the warehouse. They need more training.”

What the prompt returned

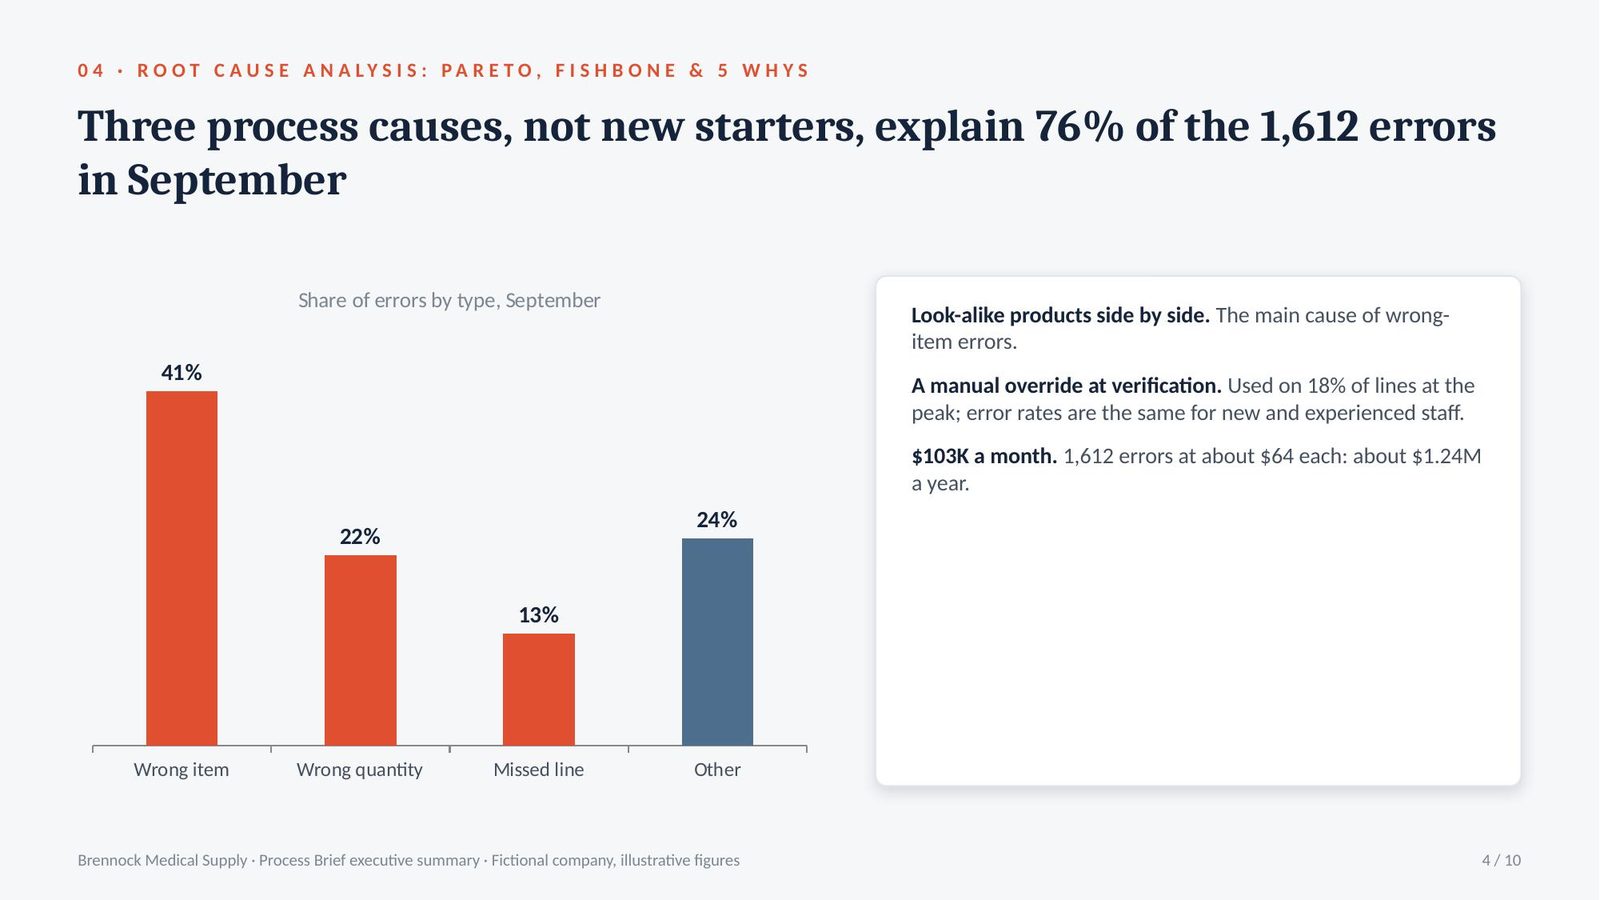
Three error types make up 76% of the 1,612 errors in September. The root causes are a manual override at verification and look-alike products stored side by side.

Wrong item41% of errors: look-alike products in adjacent pick locations
Wrong quantity22%: boxes and single units share one product code
Missed line13%: scan override used on 18% of lines at the peak
Team’s theorynew starters: not supported, error rates match across tenure

The analysis · Three process causes, not new starters, explain three quarters of the errors

A Pareto analysis ranks causes by frequency to find the few that account for most failures. A fishbone diagram groups possible causes by category, and the 5 Whys asks why repeatedly until the answer is a cause in the process.

  • 76% from three types: wrong item 41%, wrong quantity 22% and missed line 13% of the 1,612 errors logged in September.
  • The override is the process cause: verification lets a picker skip a failed scan with a manual confirm. At the peak it is used on 18% of lines, and error rates are the same for new and experienced staff.
  • $103K a month: each error costs about $64 in reshipping, credit processing and labour. 1,612 errors in September cost $103K, about $1.24M a year.

Takeaway: remove the manual override at verification and separate look-alike products before spending anything on training.

Step 5 · Improve

Failure Mode and Effects Analysis (FMEA)

Lists every way each step can fail, scores severity, likelihood and detection, and fixes the highest risks before they happen.

FMEARisk priority numberError-proofing

What Brennock brought · Head of Quality

“We lost 31 temperature-controlled parcels last quarter. What else is waiting to go wrong?”

What the prompt returned

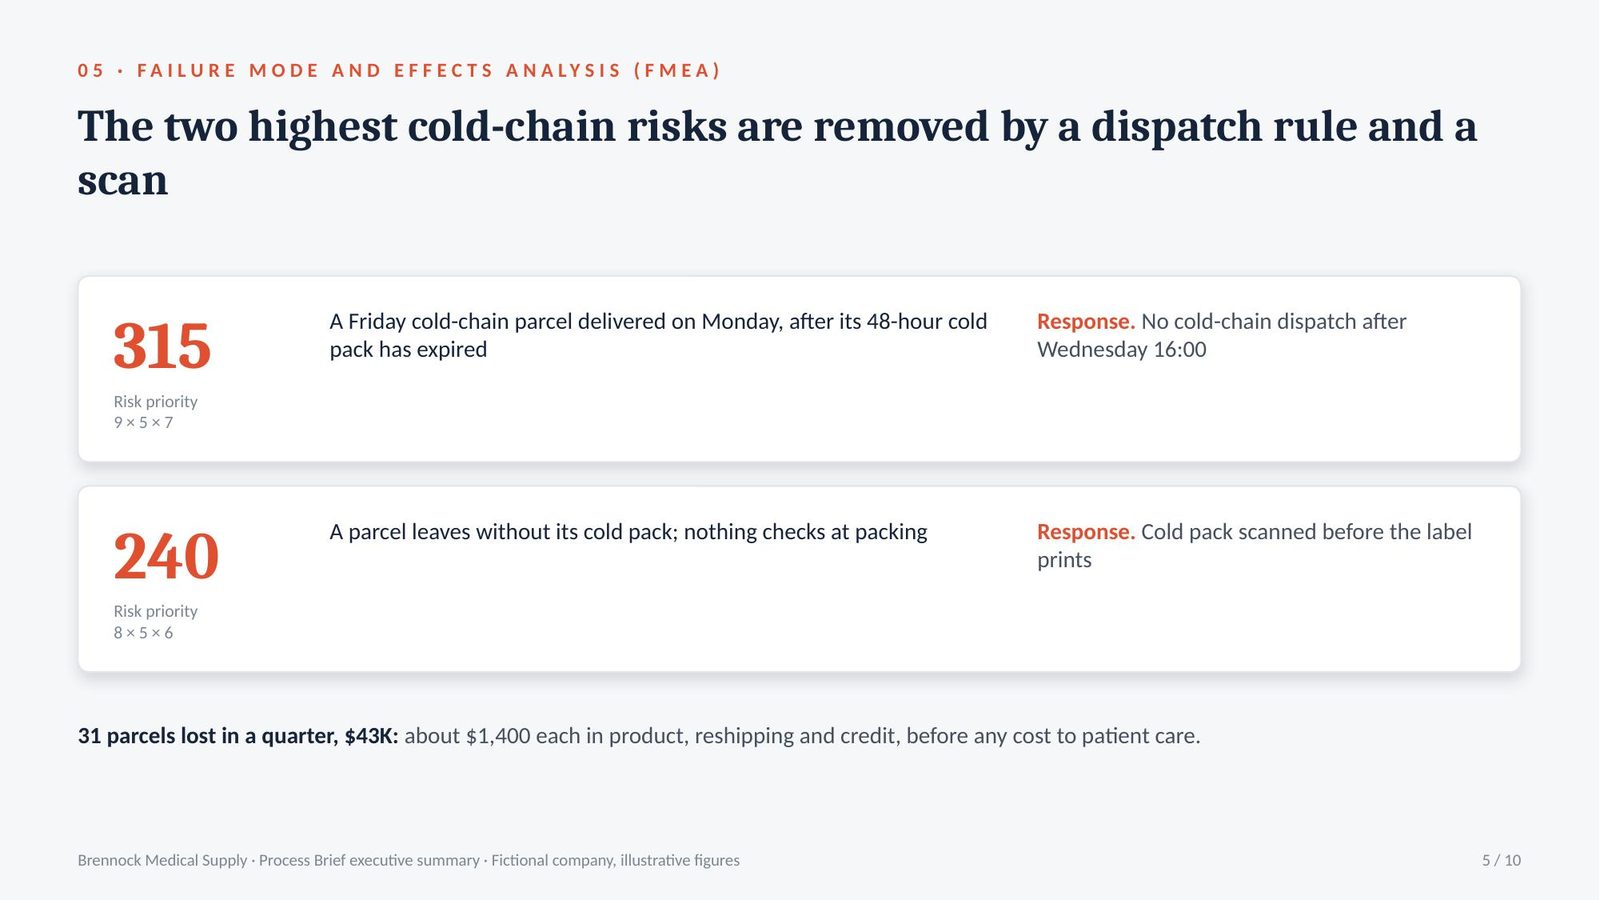
23 failure modes scored. The top risk, 315, is a temperature-controlled parcel sent on Friday and delivered on Monday after its 48-hour cold pack has expired.

Top risk, 315Friday cold-chain dispatch delivered Monday: 9 × 5 × 7
Second, 240cold pack missing, no check at packing: 8 × 5 × 6
Response 1no cold-chain dispatch after Wednesday 16:00
Response 2cold pack scanned at packing before the label prints

The analysis · The two highest risks were both preventable by a rule and a scan

Failure mode and effects analysis (FMEA) lists the ways each process step can fail and scores each on severity, occurrence and detection. Multiplied together, they give the risk priority number, used to decide which failures to prevent first.

  • 31 parcels, $43K: each lost temperature-controlled parcel costs about $1,400 in product, reshipping and credit. 31 in a quarter is $43K, before any cost to patient care.
  • 315 from a calendar: a 48-hour cold pack cannot survive a weekend. Sending cold-chain parcels only until Wednesday 16:00 removes the failure mode rather than inspecting for it.
  • 240 from a missing check: nothing stopped a parcel leaving without its cold pack. Scanning the pack before the label prints makes the error visible at the point it happens.

Takeaway: score every failure mode before it happens, and fix the top risks with rules and scans that make the error impossible, not with reminders.

Step 6 · Improve

Lean Process Redesign

Designs the future-state process: waste removed, the bottleneck relieved, root causes fixed, with the time and cost saved.

Eight wastesFuture-state mapImprovement business case

What Brennock brought · COO

“Give me the process we should be running, and what it costs to get there.”

What the prompt returned

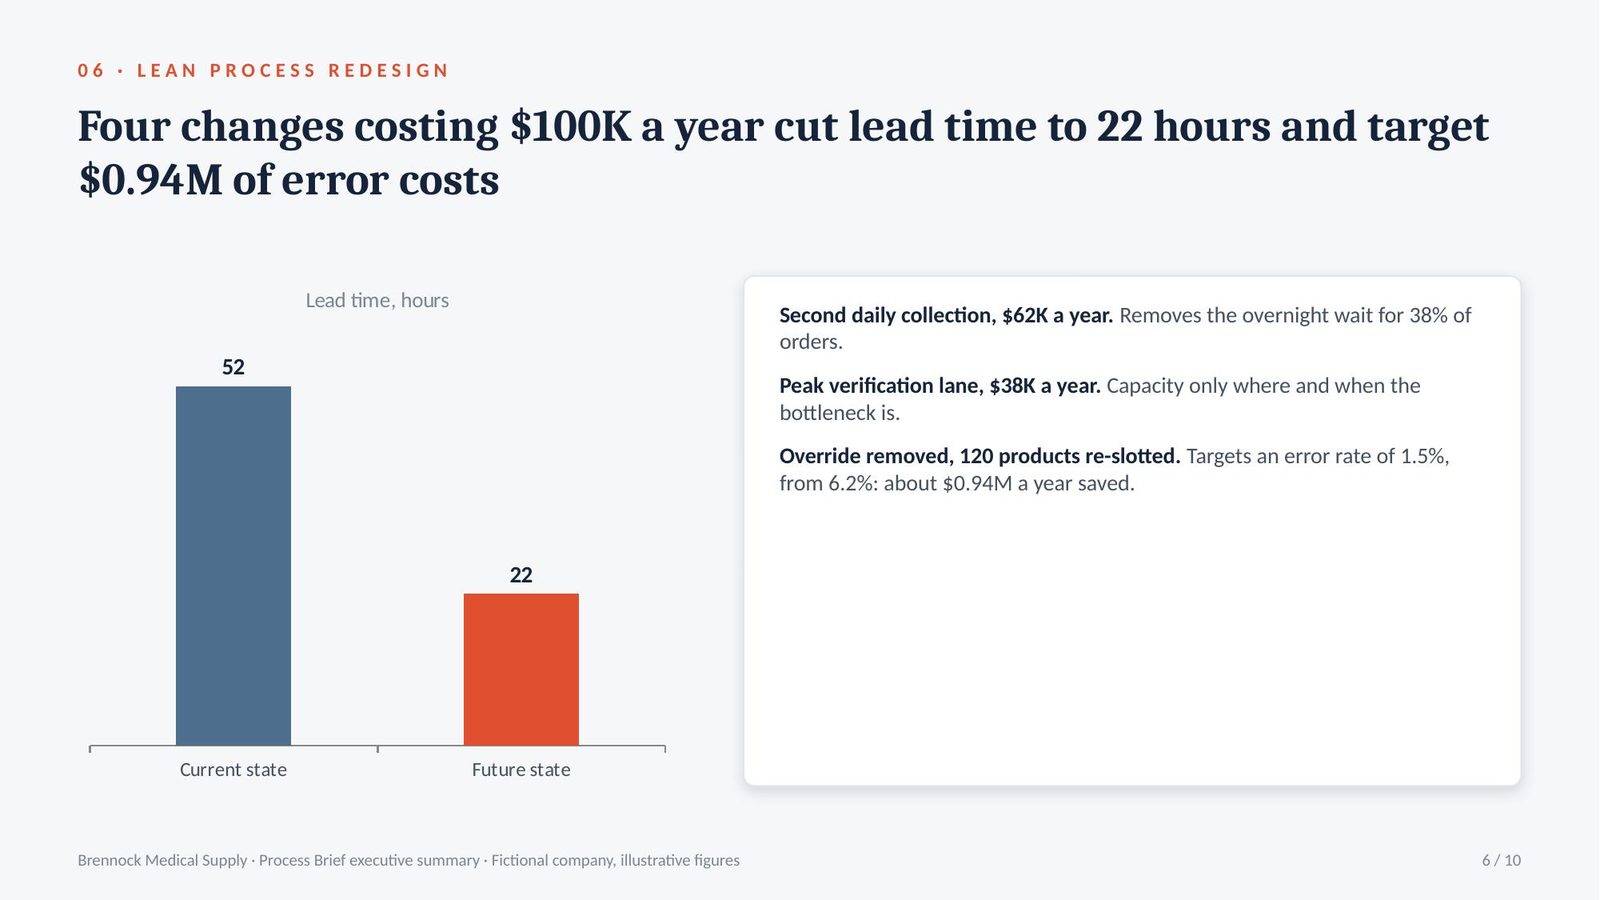
Lead time from 52 hours to 22. Four changes cost $100K a year and remove about $0.9M a year of error costs if the error rate falls to 1.5%.

Lead time52 hours to 22: the overnight wait and 3 of 11 handoffs removed
Changessecond daily collection, peak verification lane, override removed, 120 products re-slotted
Running cost$100K a year: collection $62K, verification lane $38K
Error cost removedabout $0.9M a year if errors fall from 6.2% to 1.5%

The analysis · $100K a year of changes removes about $0.9M a year of error costs

Lean process redesign removes the eight wastes from a process: transport, inventory, motion, waiting, overproduction, over-processing, defects and unused skills. The future-state map shows the process after the changes.

  • Waiting is the largest waste: a second daily collection removes the 19-hour overnight wait for 38% of orders, and brings lead time from 52 to 22 hours.
  • Defects are the most expensive waste: errors cost about $1.24M a year. Removing the override and re-slotting 120 look-alike products targets an error rate of 1.5%, saving about $0.94M a year.
  • The bottleneck gets capacity only at the peak: a second verification lane from 10:00 to 14:00 costs $38K a year, instead of adding people across the warehouse.

Takeaway: fund the four changes as one redesign, and pilot it on one shift before rolling it out.

Step 7 · Source

Supplier Selection & Vendor Evaluation

Fixes the scoring criteria before bids are opened, compares suppliers on total cost of ownership, and recommends one.

Weighted scorecardTotal cost of ownershipRequest for proposal (RFP)

What Brennock brought · CFO

“The March switch saved 9%. Why would we pay more now?”

What the prompt returned

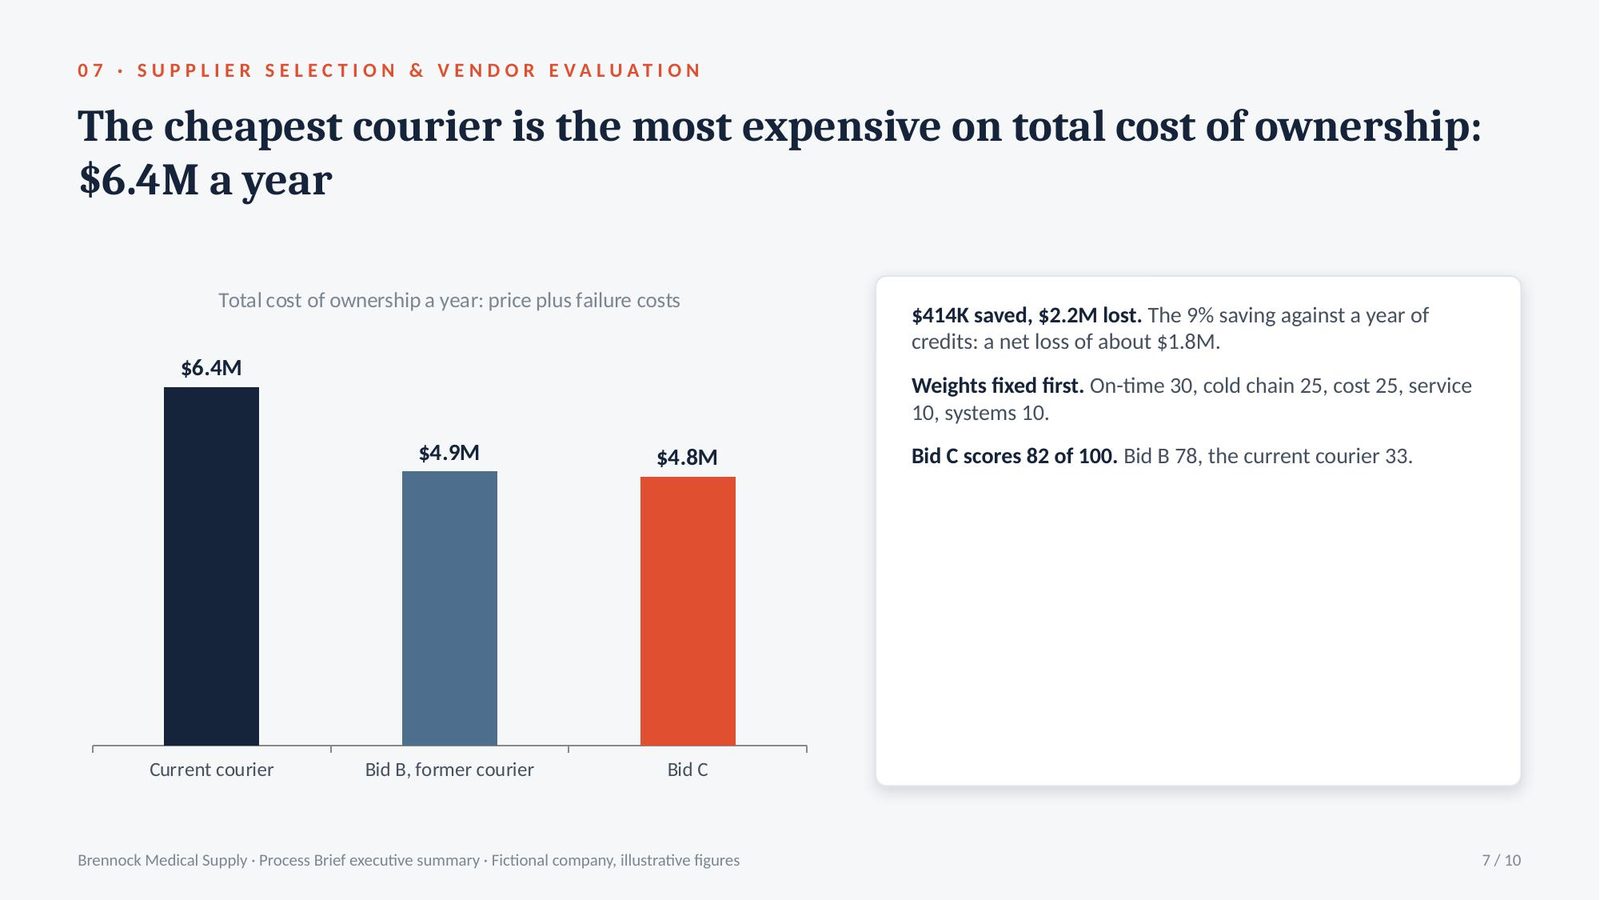
On price the current courier is cheapest at $4.19M a year. On total cost of ownership it is the most expensive at $6.4M; the recommended bid is $4.8M.

Current courierprice $4.19M, failure costs $2.2M: total $6.4M a year
Bid B, former courierprice $4.6M, failure costs $0.3M: total $4.9M
Bid Cprice $4.4M, expected failure costs $0.4M: total $4.8M, score 82 of 100
Weightsfixed before bids were opened: on-time 30, cold chain 25, cost 25, service 10, systems 10

The analysis · The 9% saving cost Brennock $1.8M a year

Total cost of ownership (TCO) adds to a supplier’s price every other cost of using it: failures, rework, switching and management time. A weighted scorecard fixes the selection criteria and their weights before any bid is opened.

  • $414K saved, $2.2M lost: the switch cut the $4.6M delivery bill by 9%, $414K a year. Credits alone ran at $1.1M in two quarters, $2.2M a year: a net loss of about $1.8M.
  • Weights fixed first: on-time performance 30, cold-chain capability 25, cost 25, service and claims 10, systems 10. The March decision had used price only.
  • Bid C at $4.8M: dearer than today’s price by $0.2M, cheaper by $1.6M on total cost, and the only bid with dedicated cold-chain vehicles.

Takeaway: fix the criteria and weights before opening bids, and compare suppliers on total cost of ownership, not on price.

Step 8 · Source

Service Level Agreement (SLA) & Contract Terms

Turns the service the business needs into measured service levels, with credits when they are missed and a way out if they keep being missed.

Service levelsService creditsExit terms

What Brennock brought · Head of Procurement

“The March contract had no service levels. When deliveries failed, we had nothing to claim.”

What the prompt returned

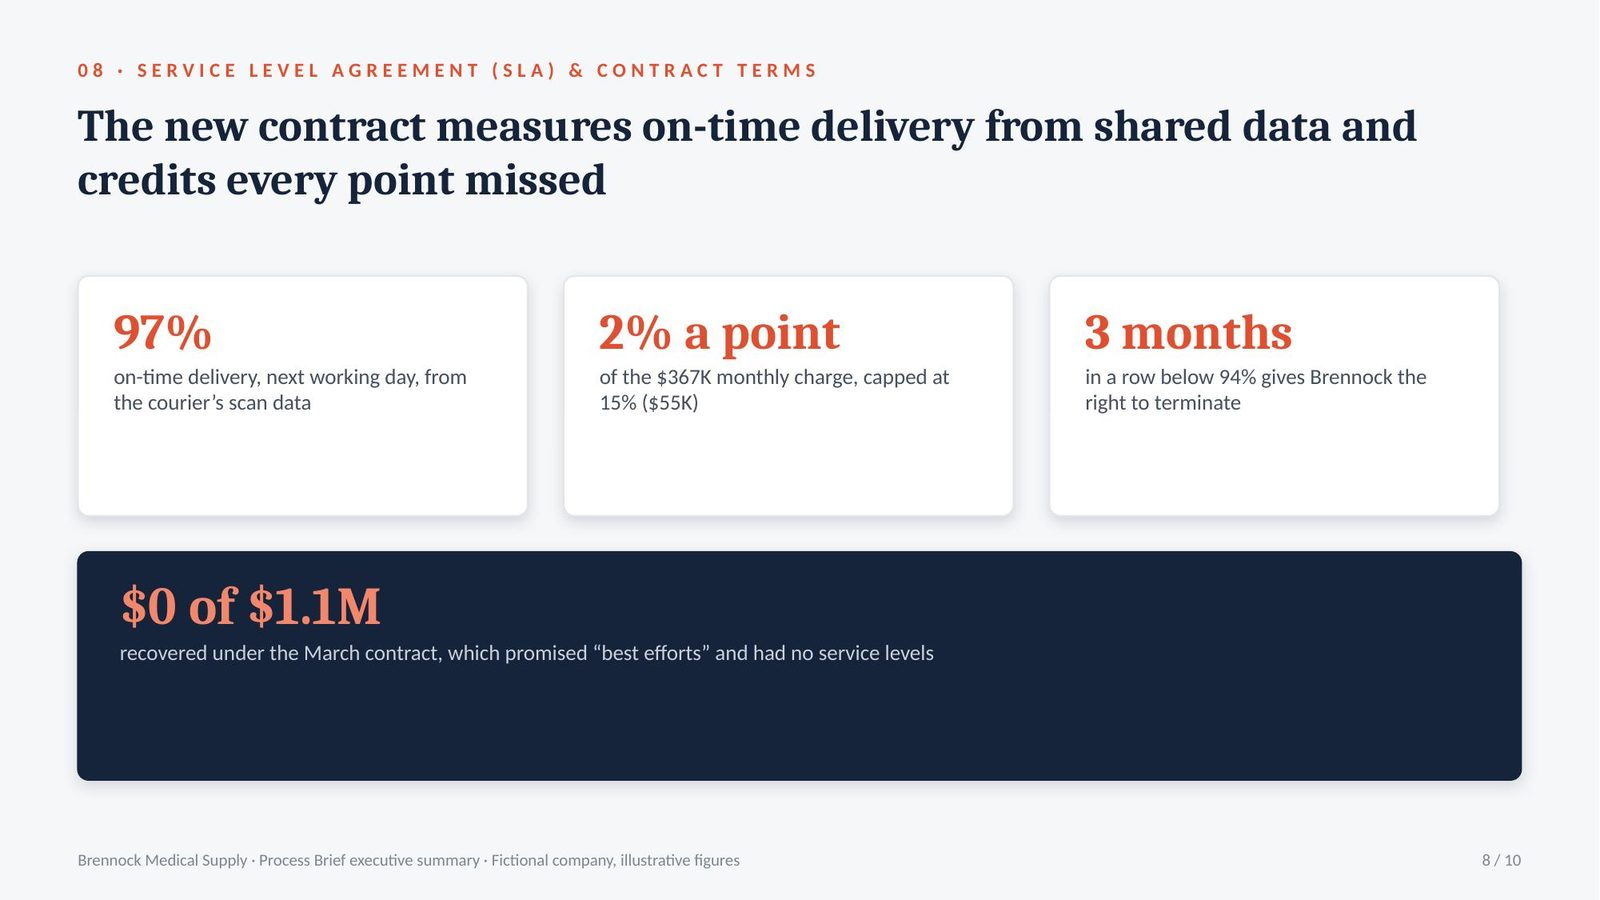
Five service levels. On-time delivery 97%, measured from the courier’s scan against the promised date; 2% of the monthly charge credited per point missed, capped at 15%.

On-time delivery97% next working day, from the courier’s scan data
Cold chain99.5% of parcels within temperature, from the logger data
Service credit2% of the monthly charge per point below target, capped at 15%
Termination rightthree consecutive months below 94%

The analysis · $1.1M of failures with no service level meant $0 recovered

A service level agreement (SLA) defines the service a supplier must deliver as measured targets. A service credit is the reduction in the supplier’s charge when a target is missed.

  • $0 of $1.1M recovered: the March contract promised “best efforts”. Brennock paid clinics $1.1M in credits and could claim none of it from the courier.
  • A credit sized to matter: Bid C’s monthly charge is about $367K. Each point below 97% costs the courier about $7.3K a month, up to a cap of $55K.
  • A way out: three consecutive months below 94% gives Brennock the right to terminate, with a 90-day handover the supplier must support.

Takeaway: measure every service level from shared data, attach a credit that matters to the supplier, and write the exit terms before signing.

Step 9 · Source

Supplier Performance Review

Scores the supplier against the SLA, calculates the credits owed, and agrees a corrective action plan with dates.

Supplier scorecardQuarterly business review (QBR)Corrective action plan

What Brennock brought · Head of Procurement

“First quarter with the new courier. They say it has gone well.”

What the prompt returned

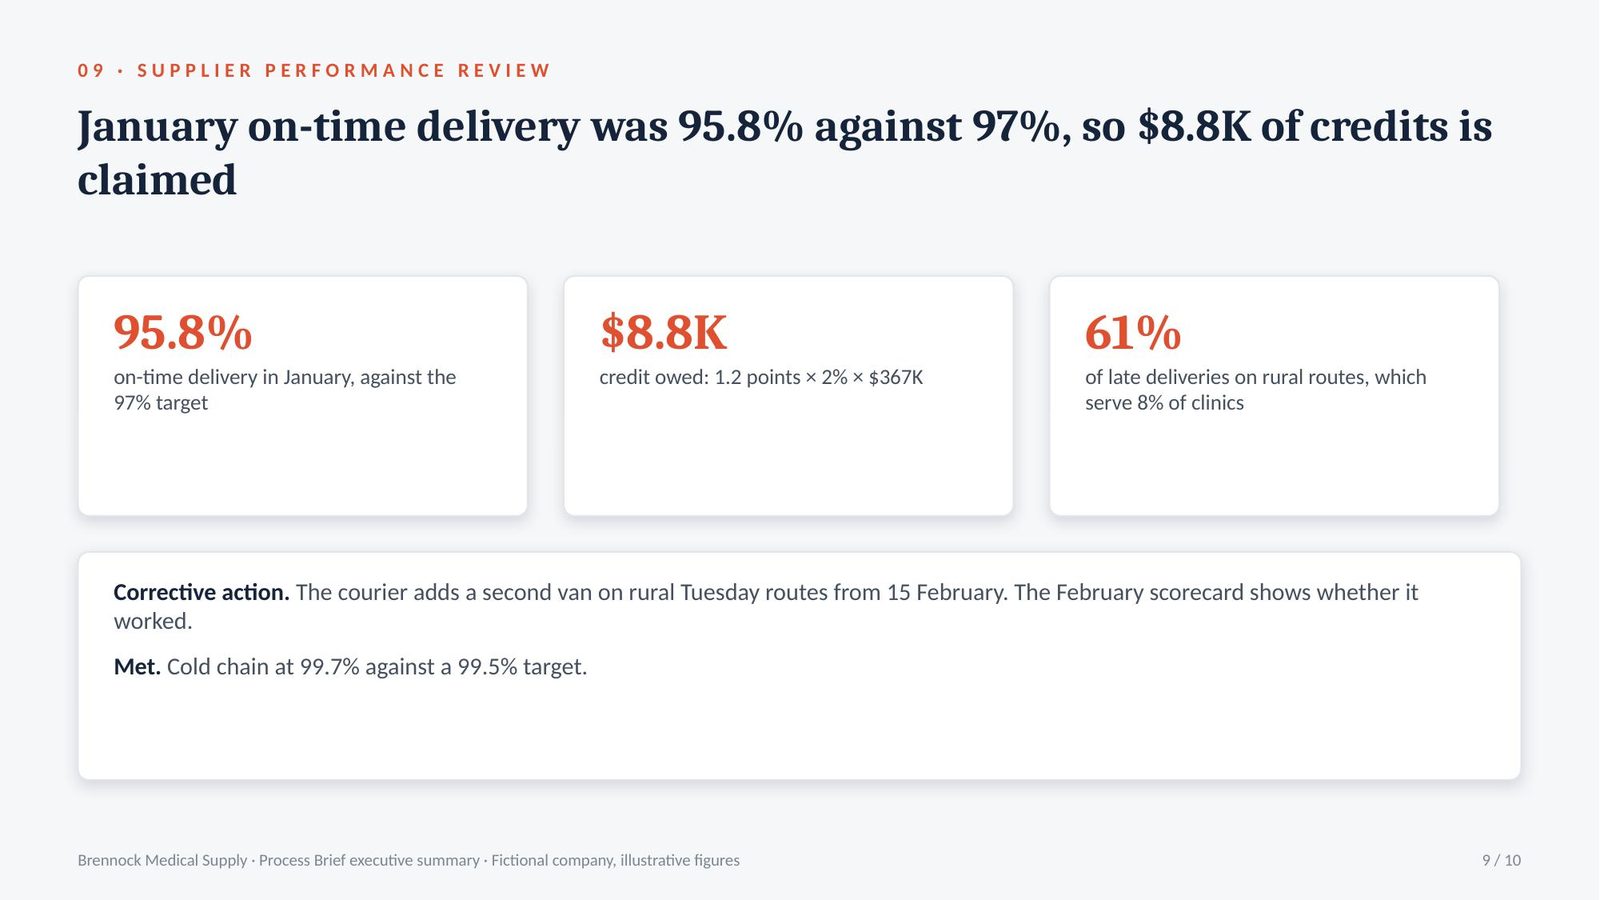
On-time delivery 95.8% against 97%: $8.8K of credits owed for January. Late deliveries cluster on rural routes on Tuesdays.

On-time delivery95.8% against 97% in January
Cold chain99.7% against 99.5%: met
Credit owed1.2 points × 2% × $367K = $8.8K
Corrective actiona second van on rural Tuesday routes from 15 February

The analysis · A 1.2-point miss is $8.8K a month and a pattern worth fixing

A supplier performance review compares a supplier’s results with its contract, calculates what is owed for misses and agrees corrective actions. A quarterly business review (QBR) is the meeting where this is done.

  • $8.8K in January: on-time delivery was 1.2 points below the 97% target. At 2% of the $367K monthly charge per point, the credit is $8.8K, and it is claimed.
  • The miss has one location: 8% of clinics are on rural routes, and those routes account for 61% of late deliveries, most of them on Tuesdays.
  • An action with a date: the courier adds a second van on rural Tuesday routes from 15 February, and the February scorecard shows whether it worked.

Takeaway: claim every credit the contract allows, and tie each corrective action to the data pattern behind the miss.

Step 10 · Control

Process Control Plan & Operations KPI Dashboard

Keeps the gains: a few measures with owners and control limits, and a written response when a limit is breached.

Control planStatistical process controlKPI dashboard

What Brennock brought · COO

“How do we make sure this doesn’t slip back in six months?”

What the prompt returned

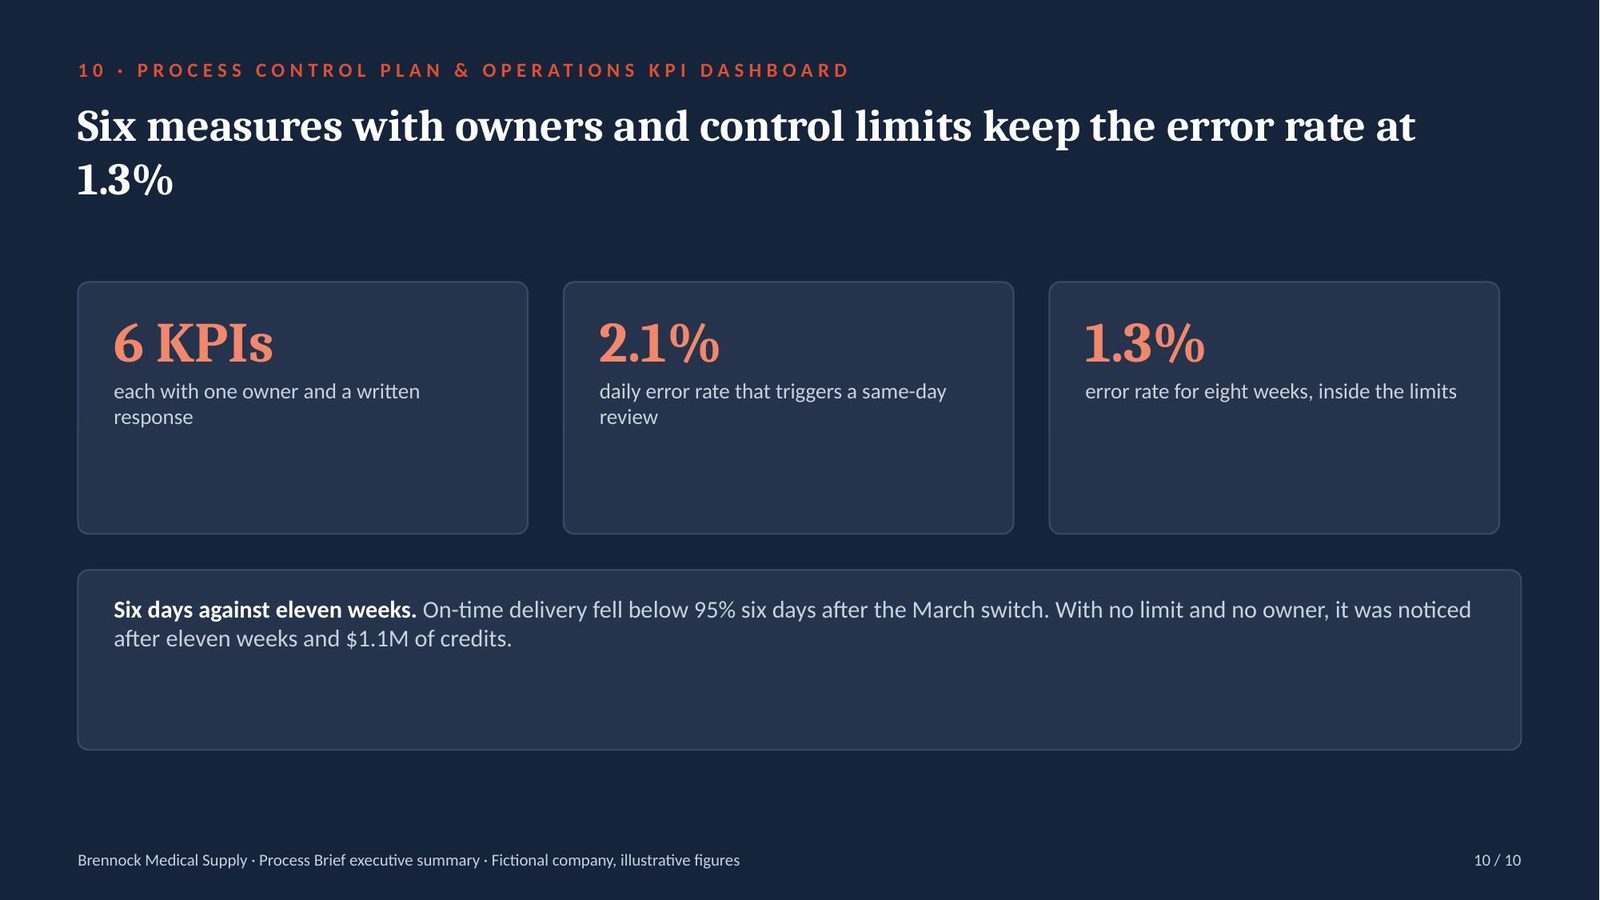
Six KPIs, each with one owner. A daily error rate above 2.1%, the upper control limit, triggers a same-day review; errors have held at 1.3% for eight weeks.

Measures6 KPIs: on-time, error rate, lead time, override use, credit days, cold chain
Upper control limitdaily error rate above 2.1% triggers a same-day review
Currenterror rate 1.3% for eight weeks, within limits
Supplieron-time below 95% for 3 days goes to the weekly courier call

The analysis · A control chart would have shown the March failure within a week

A control plan lists the measures that keep a process on standard, their limits and the response when a limit is breached. Statistical process control uses control charts to separate normal variation from a real change.

  • Six days against eleven weeks: on-time delivery fell below 95% six days after the courier switch. Without a limit or an owner, it was noticed after eleven weeks and $1.1M of credits.
  • 2.1% is calculated, not chosen: the upper control limit comes from eight weeks of daily error rates since the redesign. Above it, the warehouse manager starts a review the same day.
  • Six measures, six owners: each measure on the dashboard has one owner and a written response. Nine other measures the teams used to report were dropped.

Takeaway: give every measure an owner, control limits calculated from data, and a written response for when a limit is breached.

The finale · what prompts 01, 02 and 07 produce

What the operations team worked from

Three documents from Brennock’s Process Brief: the current-state map from prompt 01, the returns procedure from prompt 02, and the courier evaluation from prompt 07.

Order to delivery — current state

SIPOC and value stream summary, mapped on the warehouse floor

Brennock Medical Supply
About 26,000 orders a month

SuppliersInputsProcessOutputsCustomers
Manufacturers, courierClinic orders, stock, cold packsOrder received → released → picked → verified → packed → collected → deliveredCorrect order, delivered next working day, in temperature1,900 clinics

Lead time

Order received to delivery signed

52 hours

Work time

Time someone is working on the order

9 hours

Value-added share

9 ÷ 52

17%

FindingEvidenceOrders affected
Longest wait: 19 hours at the dockPacked orders wait for the single 16:00 collection38% packed after the cut-off wait overnight
14 steps, 11 handoffsCustomer service, warehouse, quality and courierAll orders
Address changes keyed in twiceOrder system and courier portalEvery changed order

Not yet confirmed

Waiting time before release to the warehouse was estimated, not measured. One day of timestamp sampling confirms it.

SOP-WH-014 — Customer returns

From return request received to credit issued · owner: Head of Quality

Version 1.0 · approved by the COO
Review in 12 months

#StepOwnerStandard
1Log the return request and issue a return numberCustomer serviceSame working day
2Book the courier collectionCustomer serviceCollection within 2 working days
3Receive the parcel and match it to the return numberGoods-inScanned on arrival
4Record lot number and expiry dateGoods-inBoth fields complete before step 5
5Quarantine temperature-controlled itemsGoods-inNever restocked. No exceptions
6Inspect other items and grade: restock, write off, return to manufacturerQualityGrade recorded against the return number
7–9Restock, write off or return to manufacturer, and update stockWarehouseStock updated the same day
10Price the credit from the original invoice lineFinanceInvoice price, not current list price
11Issue the credit and notify the clinicFinanceWithin 3 working days of receipt

Measures

Working days from receipt to credit (target 3, baseline 9) and credits disputed by clinics, reviewed monthly by the Head of Quality.

Courier selection — vendor evaluation

Weights fixed before the bids were opened · three-year contract

For the CFO
Recommendation: Bid C

CriterionWeightCurrent courierBid B, former courierBid C
On-time delivery30154
Cold-chain capability25225
Total cost of ownership25145
Service and claims10242
Systems integration10452
Weighted score, out of 100337882

Current courier

$4.19M price + $2.2M failure costs

$6.4M a year

Bid B

$4.6M price + $0.3M failure costs

$4.9M a year

Bid C

$4.4M price + $0.4M expected failure costs

$4.8M a year

Scores run from 1 to 5, weighted to 100. Conditions for the contract

Bid C scores lowest on systems integration and claims handling. Both go into the service level agreement in prompt 08 with dates.

Prompt output, formatted for this page. The prompts return the same content as text and tables; the figures come from whatever you paste in. Brennock Medical Supply is fictional, so every number here is ours to show you.

Pack 7 · Operations & Process

Ten prompt templates, one running brief

  • Process map (SIPOC and value stream) and SOP
  • Performance and capacity analysis, root cause analysis and FMEA
  • Lean process redesign with the business case
  • Supplier selection, SLA and supplier performance review, control plan
  • Text file and formatted PDF · ChatGPT, Claude and Gemini

$15

One-time purchase · instant download

Get the pack

* Brennock Medical Supply, its customers, suppliers and all figures on this page are fictional and used for illustration only. Output from these prompts depends on the information you supply and the AI tool you use. Contract and regulatory terms must be checked by a specialist; nothing here is legal advice.

Next step · the Presentation Generator

From the Process Brief to a board deck

The pack ends with the documents above. The McKinsey-Grade PowerPoint Generator is a separate product, $19: paste the Process Brief into it and it builds a board deck in Claude, as a real .pptx with native, editable charts.

Below is Brennock’s executive summary: ten slides, one for each prompt’s output, unedited.

Brennock Medical Supply Process Brief executive summary, slide 1 of 10 Brennock Medical Supply Process Brief executive summary, slide 2 of 10 Brennock Medical Supply Process Brief executive summary, slide 3 of 10 Brennock Medical Supply Process Brief executive summary, slide 4 of 10 Brennock Medical Supply Process Brief executive summary, slide 5 of 10 Brennock Medical Supply Process Brief executive summary, slide 6 of 10 Brennock Medical Supply Process Brief executive summary, slide 7 of 10 Brennock Medical Supply Process Brief executive summary, slide 8 of 10 Brennock Medical Supply Process Brief executive summary, slide 9 of 10 Brennock Medical Supply Process Brief executive summary, slide 10 of 10
1 / 10

Brennock Medical Supply is fictional, so every number here is ours to show you. Generated in the NOVA house style.

Microsoft PowerPoint Want the deck built for you in one shot? The McKinsey-Grade PowerPoint Generator — $19

Built in Claude as a real .pptx with native, editable charts. Or take both generators together in the bundle, $25.

Back to The Prompt Library