Prompts for Work · Pack 6 · 10 prompt templates

HR & Talent
AI Prompt Templates

Ten prompts that take a role from the headcount decision to the stay interview. Every requirement is testable, every candidate answers the same questions, and every people decision carries its cost.

ChatGPT, Claude & Gemini Instant download No subscription Lifetime updates

Plan, attract, select, develop, retain

Run any prompt on its own, or run all ten in order. Each output feeds the next, building one Talent Brief that the offer, the appraisal and the retention review all check against.

Four rules in every prompt

These are what stop the AI hiring, rating or paying people on impressions.

Job-related evidence only

Every requirement, question and rating traces to an outcome the role must deliver. “Culture fit”, gut feel and anything about age, family, health, religion, nationality or other protected characteristics are out.

Same questions, same scale

Every candidate and every employee is assessed against the same questions and the same anchored rating scale, so results can be compared and defended.

Score before you discuss

Interviewers and managers write their ratings and evidence independently before any group discussion, so the most senior voice does not set everyone else’s score.

Cost every people decision

Vacancies, mis-hires, offers and resignations are stated in money, with the arithmetic shown. A people decision without a cost is decided on opinion.

One company, all ten prompts

Orrin sells revenue-analytics software to B2B companies: $42M in annual recurring revenue, 310 customers, 240 staff. In January 2026 it hired a Head of Customer Success on a “10+ years in SaaS, strategic leader” job description. He left in August. By the time a replacement starts, the mis-hire will have cost $287K, net revenue retention has fallen from 108% to 97%, and 3 of the 9 customer success managers have resigned. Here is how the ten prompts take Orrin from that failure to a hire, a team and a retention plan, one step at a time.*

$287K

cost of the mis-hire, by the time a replacement starts

108% → 97%

net revenue retention in one year

3 of 9

customer success managers resigned

7 months

in the role before the last hire left

Step 1 · Plan

Strategic Workforce Plan & Headcount Case

Decides whether to build, buy or borrow the capability, and what each month without it costs.

Build / buy / borrowCost of vacancyHeadcount business case

What Orrin brought · CFO

“The board wants to know why we are rehiring a role that just cost us $287K.”

What the prompt returned

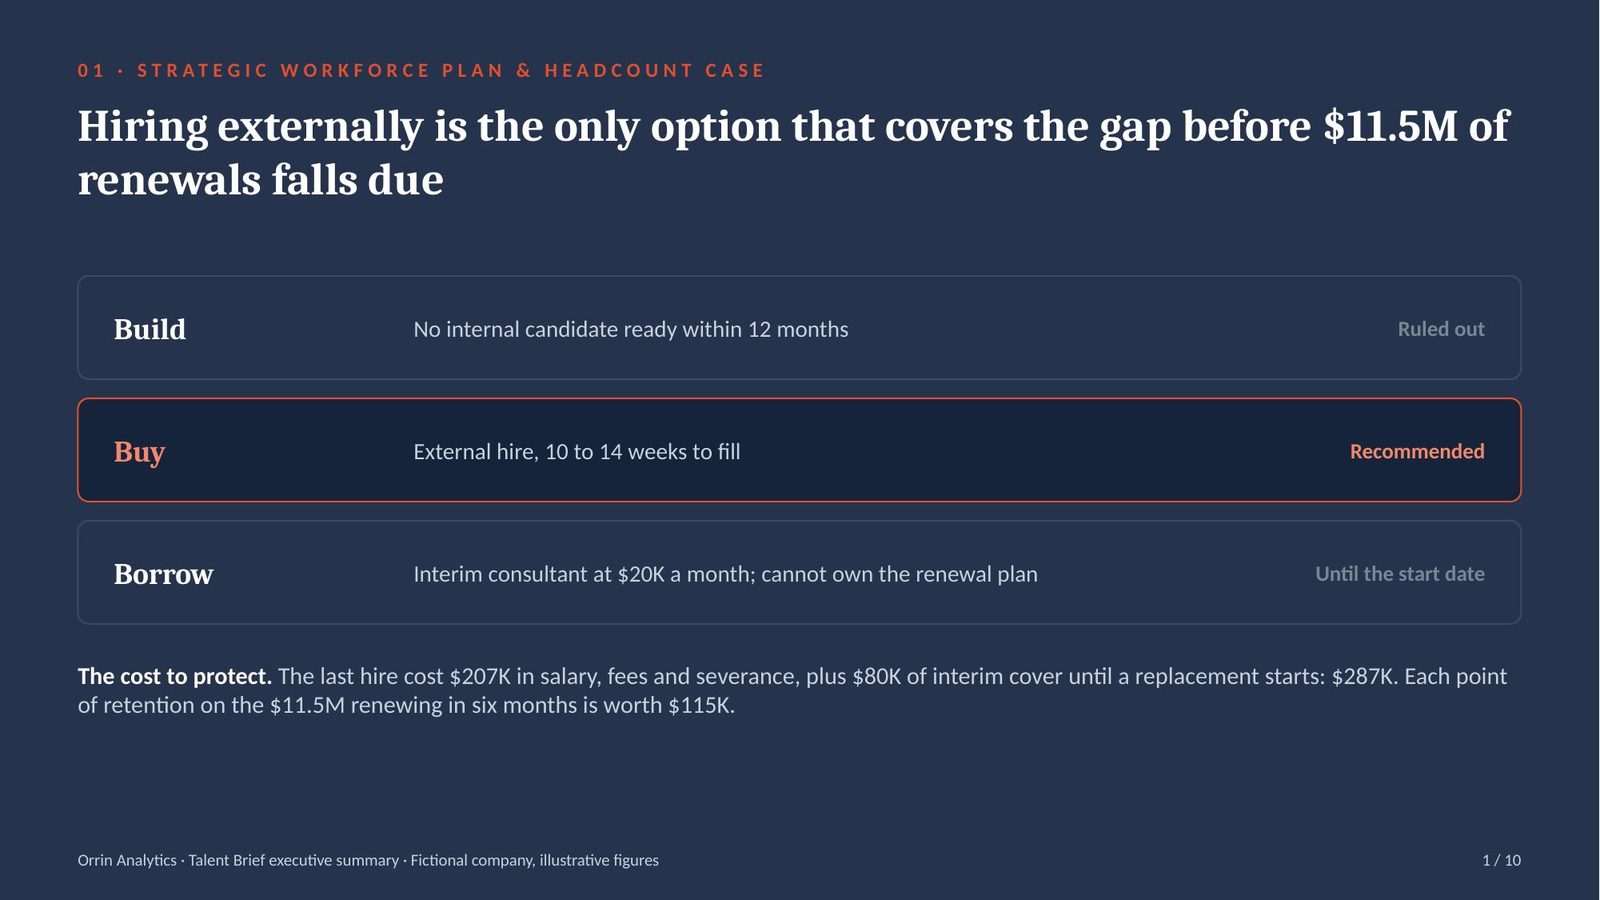
Buy, not build: no internal candidate is ready within 12 months. Interim cover costs $20K a month, and $11.5M of renewals falls due in the next six months.

Buildno internal candidate ready within 12 months
Buyexternal hire, 10 to 14 weeks to fill
Borrowinterim consultant, $20K a month until the start date
Renewals in six months$11.5M across 96 accounts

The analysis · Hiring is the only option that covers the gap before $11.5M of renewals falls due

A workforce plan compares the work the business needs done with the people it has, and decides for each gap whether to build (develop someone internally), buy (hire) or borrow (contract).

  • Build takes 12 months or more: both customer success team leads have under two years in role and have never owned a renewal target. Developing either would leave the gap open through every renewal in the next year.
  • Borrow costs $20K a month and owns nothing: the interim consultant covering since August runs the weekly meeting but cannot hire, reset targets or own the renewal plan. Four months of cover adds $80K to the $207K already lost on salary, fees and severance.
  • Buy protects $11.5M: 96 accounts worth $11.5M renew in the next six months. At a 97% net revenue retention rate, each point of retention on that book is worth $115K.

Takeaway: hire externally now, keep interim cover only until the start date, and give the new hire the $11.5M renewal book as the first-year target.
Step 2 · Plan

Job Analysis & Job Description

Writes the role from the outcomes it must deliver, with requirements stated as skills that can be tested.

Job analysisCompetency frameworkSkills-based requirements

What Orrin brought · COO

“The last description asked for 10+ years in SaaS and a “strategic leader”. We got exactly that.”

What the prompt returned

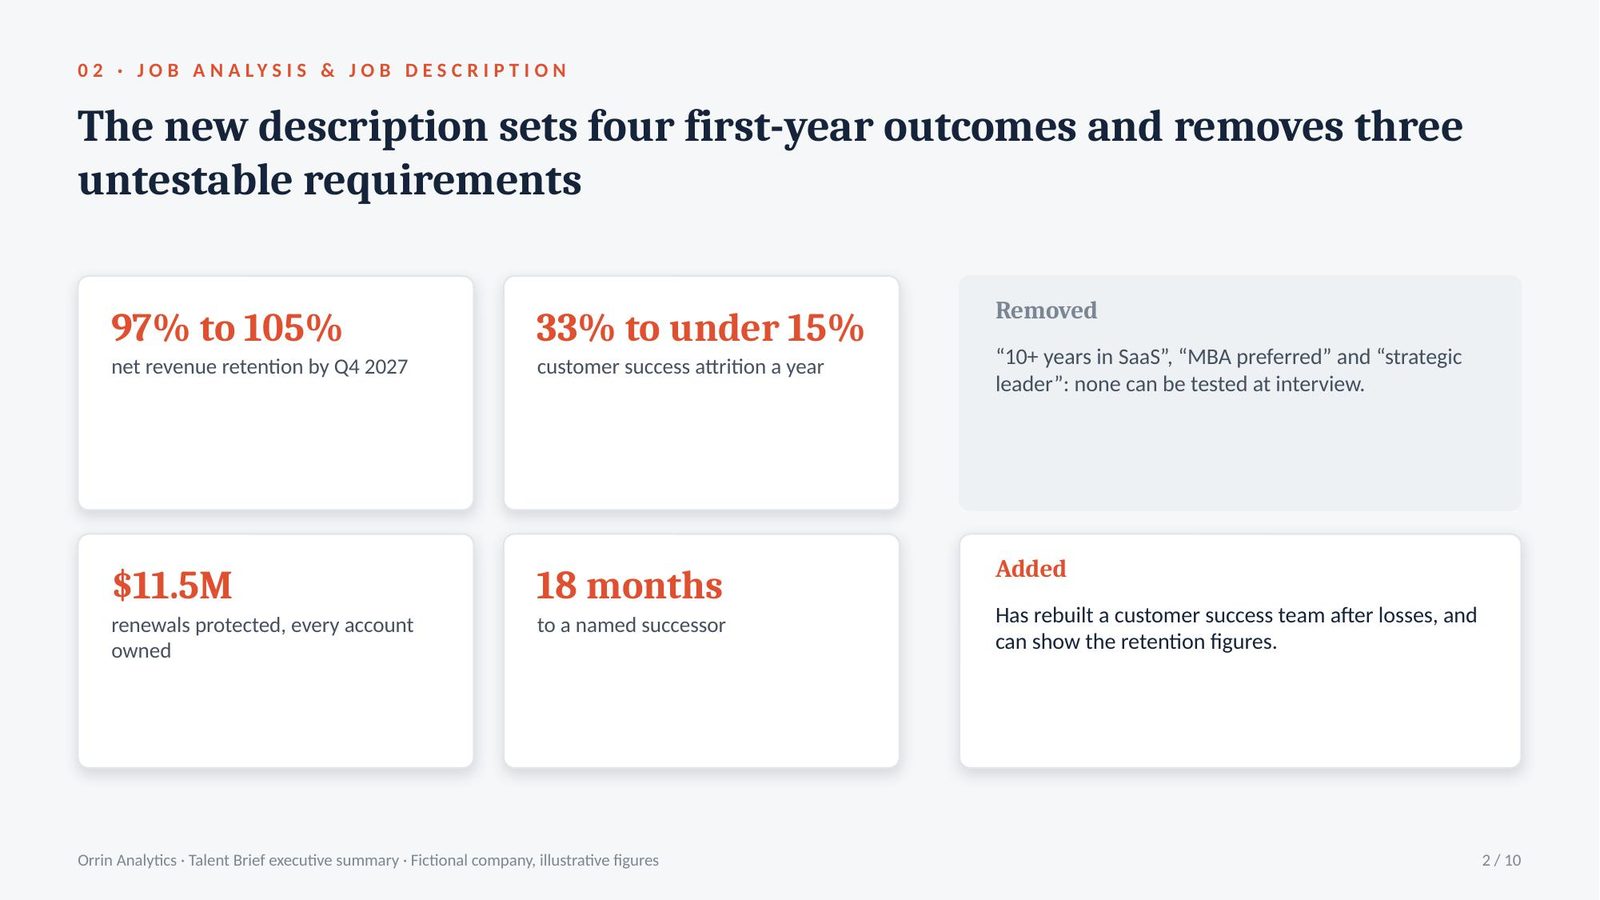
Four outcomes for year one, six competencies, and three requirements removed.

Outcome 1net revenue retention from 97% to 105% by Q4 2027
Outcome 2customer success attrition from 33% to under 15% a year
Removed“10+ years in SaaS”, “MBA preferred”, “strategic leader”
Addedhas rebuilt a customer success team after losses, and can show the retention figures

The analysis · The old description selected for seniority, and the role needed a turnaround

Job analysis is the study of what a role must achieve and which skills produce that result; the job description is written from it. Skills-based requirements state what a candidate must be able to do and show, instead of the years or qualifications they hold.

  • The old description described a person: “10+ years in SaaS” and “strategic leader” were the two lines the last hire met best. He left after 7 months, and the mis-hire cost $287K.
  • Four outcomes replace the adjectives: net revenue retention back to 105%, attrition under 15%, the $11.5M renewal book protected, and a named successor within 18 months. Each has a baseline and a date.
  • One requirement does the work of three: “Has rebuilt a customer success team after losses, and can show the retention figures” replaced years, an MBA and a title, because it is the only one of the four that describes the situation Orrin is in.

Takeaway: write the description from first-year outcomes, and remove any requirement that cannot be tested at interview.

Step 3 · Attract

Employer Value Proposition (EVP) & Sourcing Strategy

States honestly why the right candidate would take the job, and works out where they will come from and how many to approach.

Employer value propositionSourcing channelsRecruitment funnel

What Orrin brought · Head of Talent

“Last time we posted on LinkedIn and paid a recruiter 25%.”

What the prompt returned

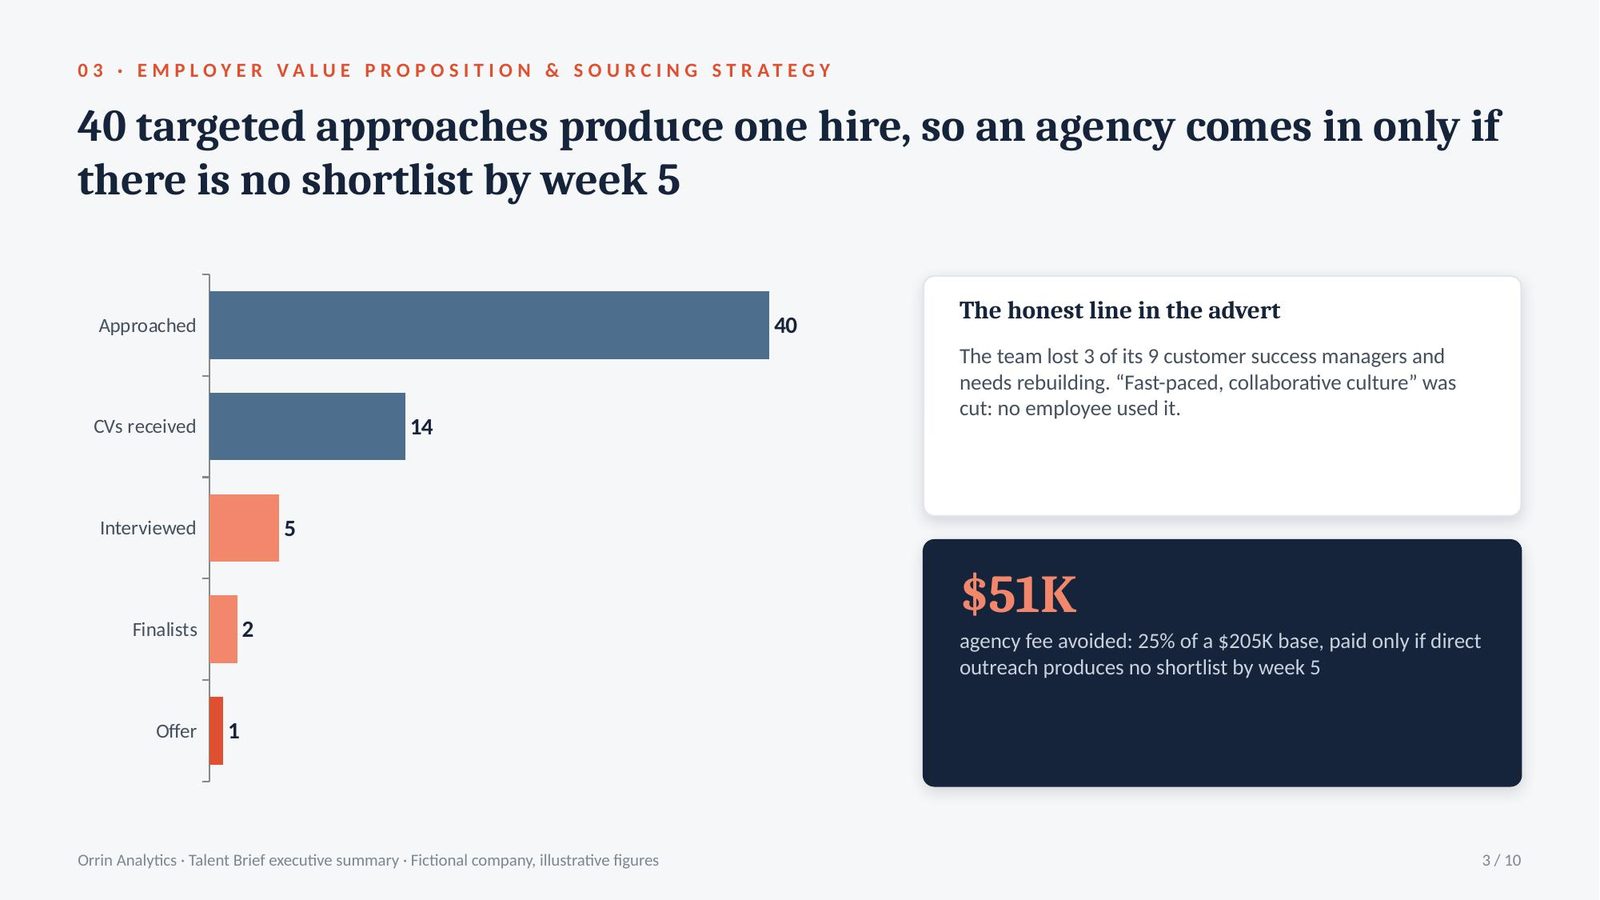
40 approaches for one hire. Direct outreach and referrals first; an agency only if there is no shortlist by week 5.

Funnel40 approached, 14 CVs, 5 interviews, 2 finalists, 1 offer
Cut from the advert“fast-paced, collaborative culture”: no employee used it
The honest linethe team lost 3 of 9 people and needs rebuilding
Agencyonly if no shortlist by week 5: saves a $51K fee

The analysis · Stating the difficulty in the advert attracts the candidate the job needs

An employer value proposition (EVP) is the set of reasons a person would choose to work for a company, stated as what the job gives them. A sourcing strategy decides where candidates will come from and how many must be approached to make one hire.

  • The claim no employee made: “fast-paced, collaborative culture” appeared in the old advert and in none of 70 employee survey comments. It was cut and replaced with what the job actually is.
  • The difficulty is the selling point: the advert states that the team lost 3 of its 9 customer success managers and needs rebuilding. That excludes candidates looking for a stable team, which is the profile that failed last time.
  • 40 approaches, and a $51K fee avoided: at Orrin’s past conversion rates, 40 targeted approaches produce about 14 CVs and one offer. An agency at 25% of the $205K base would cost $51K, so it is used only if there is no shortlist by week 5.

Takeaway: state the real difficulty of the job in the advert, and approach 40 named people before paying an agency fee.

Step 4 · Select

Structured Interview Guide & Scoring Rubric

Screens CVs against knockout criteria, then builds the same questions and the same anchored scale for every candidate.

Structured interviewAnchored rating scaleKnockout criteria

What Orrin brought · COO

“Four of us interviewed the last hire. Everyone asked their own questions, and everyone liked him.”

What the prompt returned

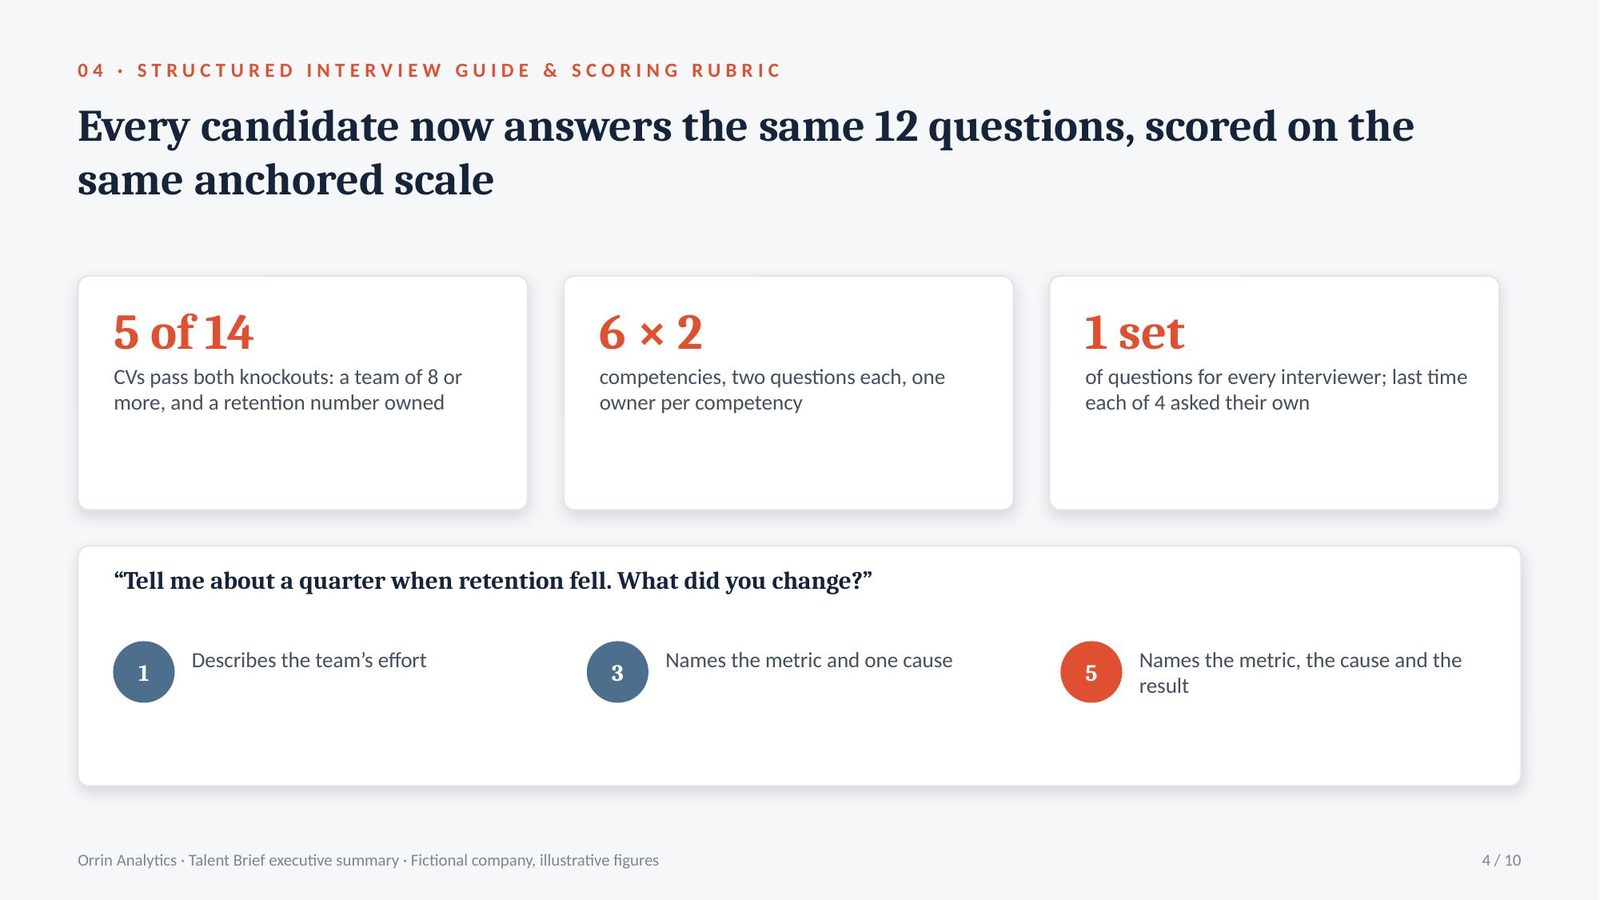
14 CVs screened, 5 pass both knockouts. Six competencies, two questions each, and a 1-to-5 scale with the behaviour defined at 1, 3 and 5.

Knockout 1has led a customer success team of 8 or more
CV screen14 received, 5 pass both knockouts
Question“Tell me about a quarter when retention fell. What did you change?”
Anchors1: describes the team’s effort · 5: names the metric, the cause and the result

The analysis · Four interviewers asking their own questions produced four scores that could not be compared

A structured interview asks every candidate the same questions in the same order and rates each answer on an anchored scale, where each score point is defined by an observable behaviour.

  • Four interviews, no shared question: on the last hire, no two interviewers asked the same question, so there was nothing to compare. All four rated him highly on impressions, and the $287K cost followed.
  • The anchor decides the score: a 1 describes the team’s effort in general terms; a 5 names the metric, the cause found and the result. Two interviewers hearing the same answer now give the same score.
  • 9 of 14 CVs out on two knockouts: leading a team of 8 or more and owning a retention number. Each rejection records the missing evidence, so the decision can be explained to the candidate.

Takeaway: give every interviewer the same questions and anchored scale, and assign each competency to one interviewer.

Step 5 · Select

Selection Decision & Reference Check

Combines independent scores into a hire or no-hire decision, and checks references against the scorecard.

Independent scoringCalibrated debriefEvidence-based references

What Orrin brought · Head of Talent

“Two finalists. The CEO already prefers Candidate A.”

What the prompt returned

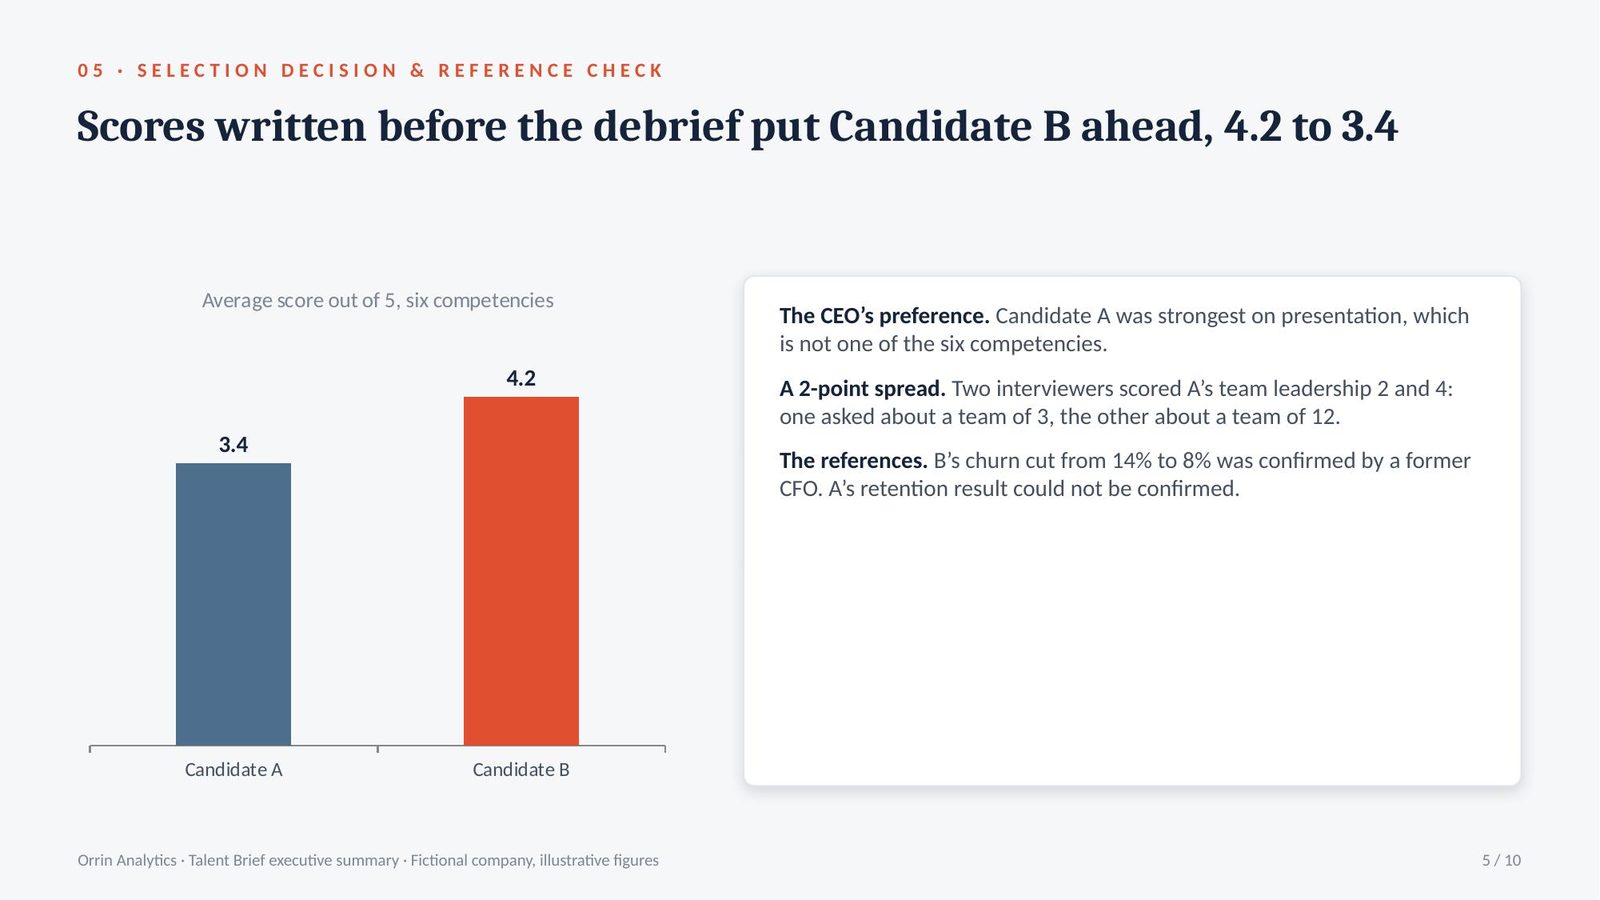
Candidate B averages 4.2 against A’s 3.4 on independent scores. References confirm B’s retention figures; A’s could not be confirmed.

Candidate A3.4 average, strongest on presentation, which is not a competency
Candidate B4.2 average, 5 on retention diagnosis
Spread of 2 pointsA on team leadership: the panel saw different evidence
Reference, Bchurn from 14% to 8%, confirmed by a former CFO

The analysis · Independent scores reversed the CEO’s first preference

A selection decision combines interviewers’ scores into a hire or no-hire recommendation. Scores are written independently before the debrief, because once a senior person states a view, other interviewers’ scores move towards it.

  • 3.4 against 4.2: written before the debrief, the panel’s scores put Candidate B ahead on five of six competencies. The CEO’s preference for A rested on presentation, which the scorecard does not measure.
  • A 2-point spread is a question, not an average: two interviewers scored A’s team leadership 2 and 4. The debrief found one had asked about a team of 3, the other about a team of 12.
  • References tested a figure: B’s claim of cutting churn from 14% to 8% was confirmed by a former CFO. A’s claimed retention result could not be confirmed by either referee.

Takeaway: collect scores before the debrief, discuss every 2-point disagreement, and ask referees to confirm specific figures.

Step 6 · Select

Compensation Benchmark & Offer Structure

Prices the offer against the market and the internal pay band, and sets the limits before negotiation.

Market pay percentilesInternal equityTotal rewards

What Orrin brought · CFO

“Candidate B wants $215K base. The last hire was on $190K.”

What the prompt returned

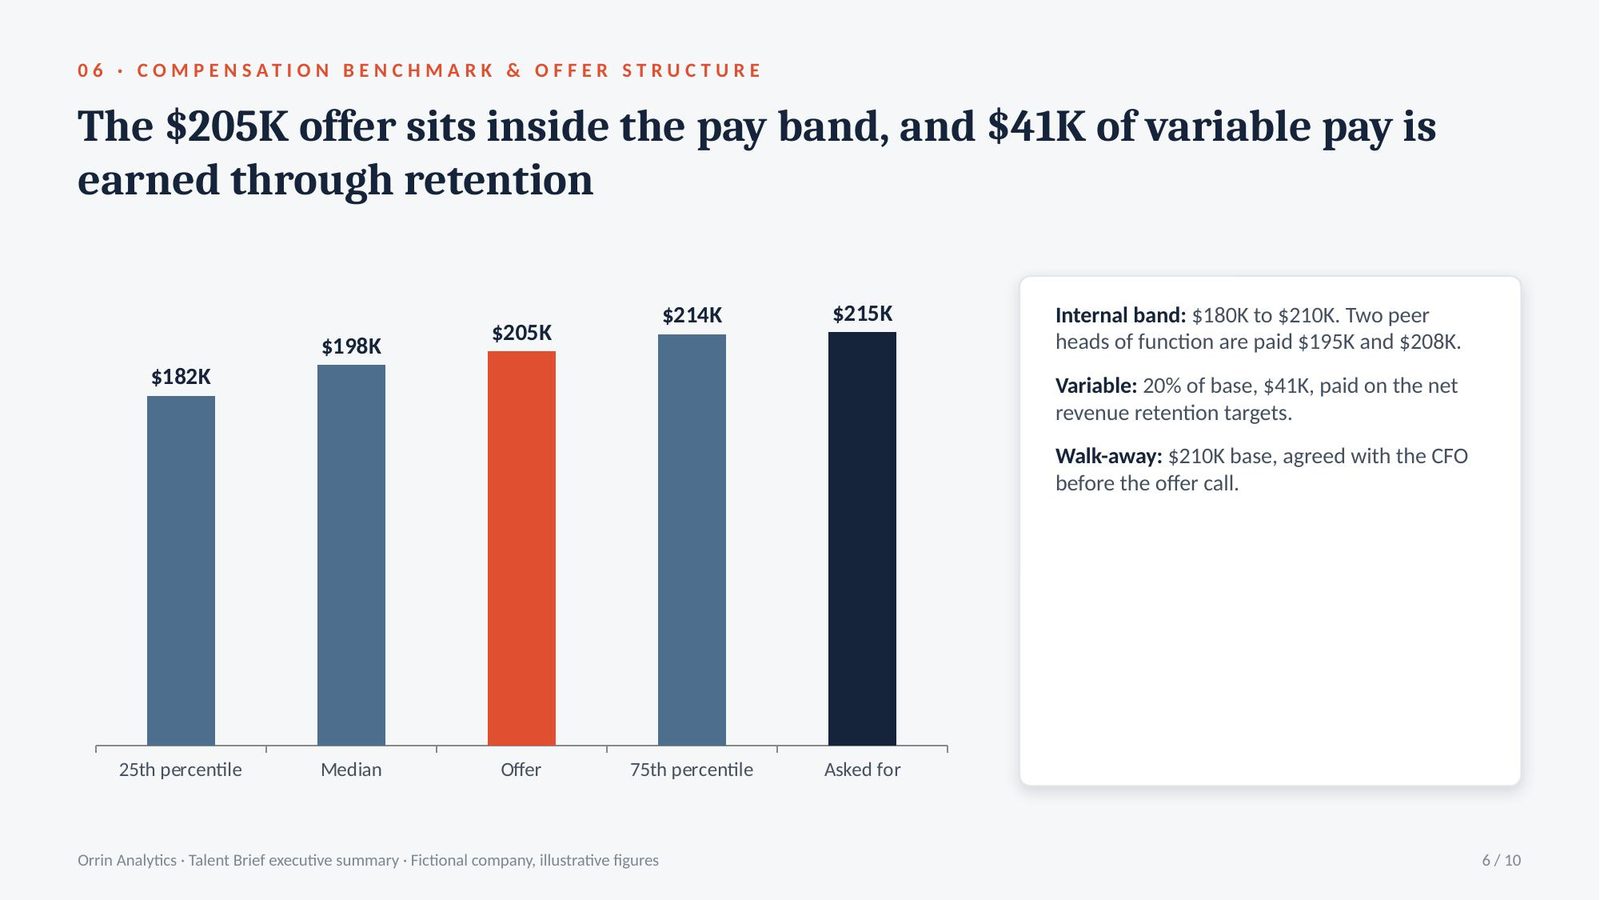
Market median $198K, 75th percentile $214K. Offer $205K base plus 20% variable tied to retention, with $210K as the walk-away.

Market data25th $182K · median $198K · 75th $214K
Internal band$180K to $210K, two peer heads of function at $195K and $208K
Offer$205K base plus 20% variable on net revenue retention
Asked for$215K: above the band and the 75th percentile

The analysis · Meeting the $215K ask would have set a new top of the band for every peer

A pay percentile shows where a salary sits in the market: at the 75th percentile, 75% of comparable roles pay less. Internal equity compares an offer with what peers in similar roles are paid.

  • $215K breaks two limits: it is above the 75th percentile of $214K and above the internal band maximum of $210K, where two peer heads of function sit at $195K and $208K.
  • $41K paid only for results: 20% variable on the $205K base is $41K, paid against the net revenue retention targets in the job description, so the extra pay is earned through retention.
  • The walk-away was written first: the limit of $210K base and the items that could move before it, such as a signing bonus and a six-month review, were agreed with the CFO before the offer call.

Takeaway: price the offer from market percentiles and the internal band, and tie the variable pay to the role’s first-year outcomes.

Step 7 · Develop

Onboarding Plan (30-60-90)

Sets what the new hire learns, whom they meet and what they deliver at 30, 60 and 90 days.

30-60-90 planTime to productivityEarly wins

What Orrin brought · COO

“The last hire spent his first month in product training and met customers in month three.”

What the prompt returned

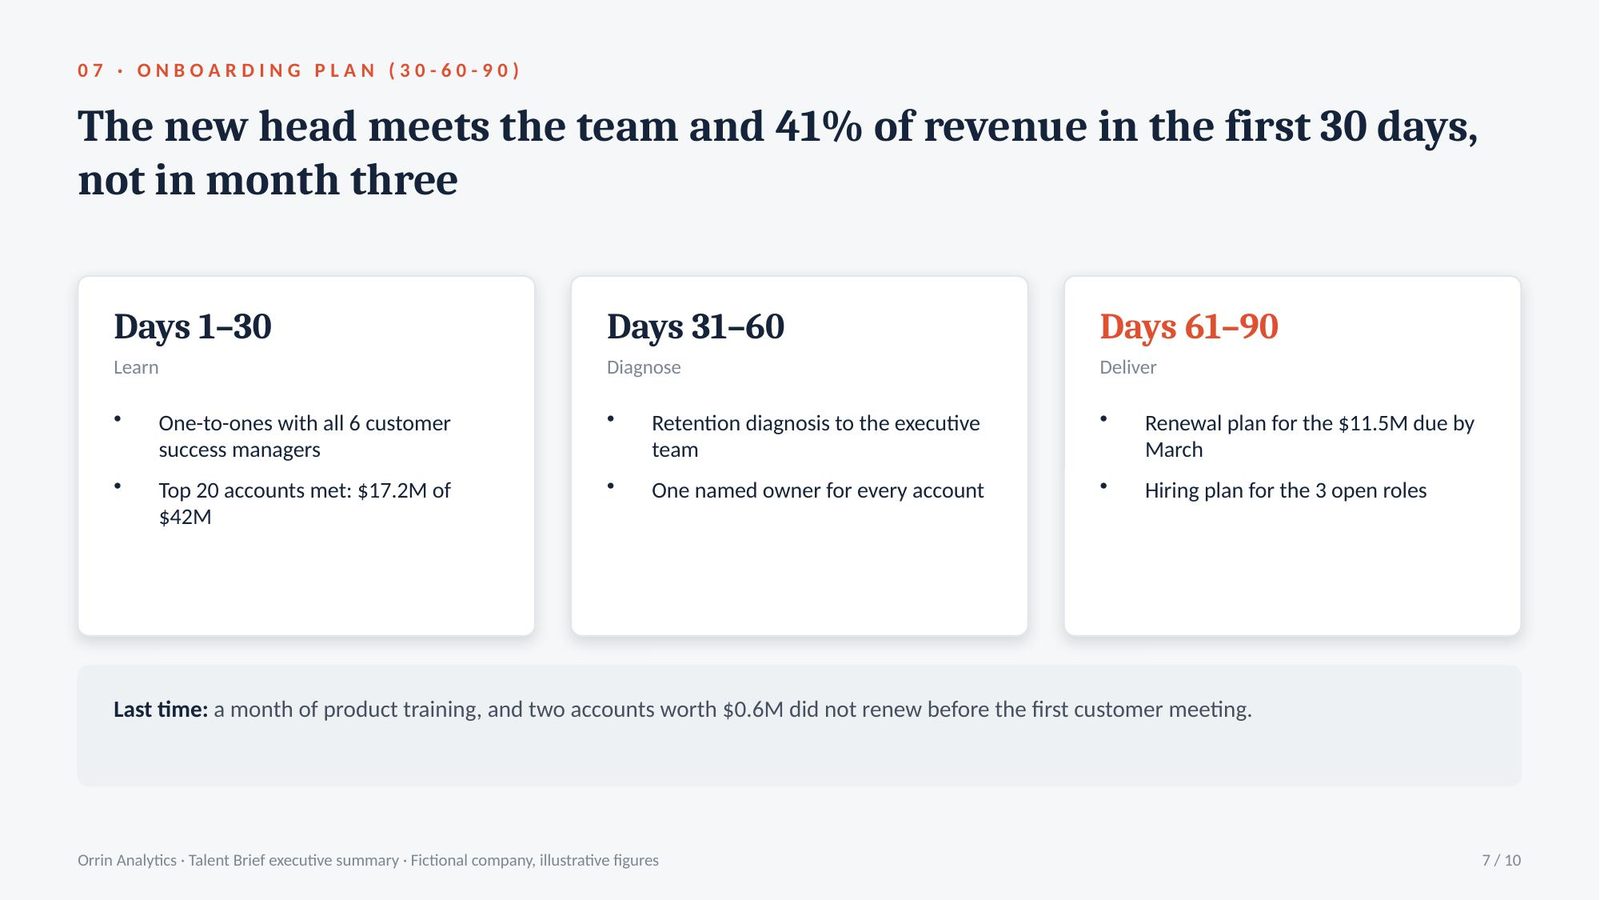
By day 30: all 6 customer success managers and the top 20 accounts met. Day 60: the retention diagnosis. Day 90: the renewal plan for $11.5M.

Day 306 one-to-ones done, top 20 accounts met (41% of revenue)
Day 60retention diagnosis presented to the executive team
Day 90renewal plan for the $11.5M due by March
Reviewsweekly with the COO, and 30, 60 and 90-day criteria set in advance

The analysis · The last hire met customers only after two of them had left

A 30-60-90 plan sets what a new hire learns, diagnoses and delivers in each of their first three months. Time to productivity is the time until the hire performs the role’s core work without support, and it is measured against criteria written before day one.

  • Two accounts, $0.6M, before the first customer meeting: the last hire spent month one in product training. Two accounts worth $0.6M did not renew before he met them in month three.
  • 41% of revenue met in 30 days: the top 20 accounts hold $17.2M of the $42M, so meeting them first covers the largest share of risk in the fewest meetings.
  • A deliverable, not a feeling, at 90 days: the day-90 review asks one question: is there a renewal plan for the $11.5M due by March, with an owner for every account?

Takeaway: put the new hire in front of the team and the largest customers in the first 30 days, and set the day-90 deliverable before day one.

Step 8 · Develop

Performance Appraisal & Calibration

Writes evidence-based reviews against goals, and calibrates ratings across managers before they are shared.

Goals (OKRs)SBI feedbackRating calibration

What Orrin brought · Head of Customer Success

“Mid-year reviews are due. One of my managers rates almost everyone “exceeds”.”

What the prompt returned

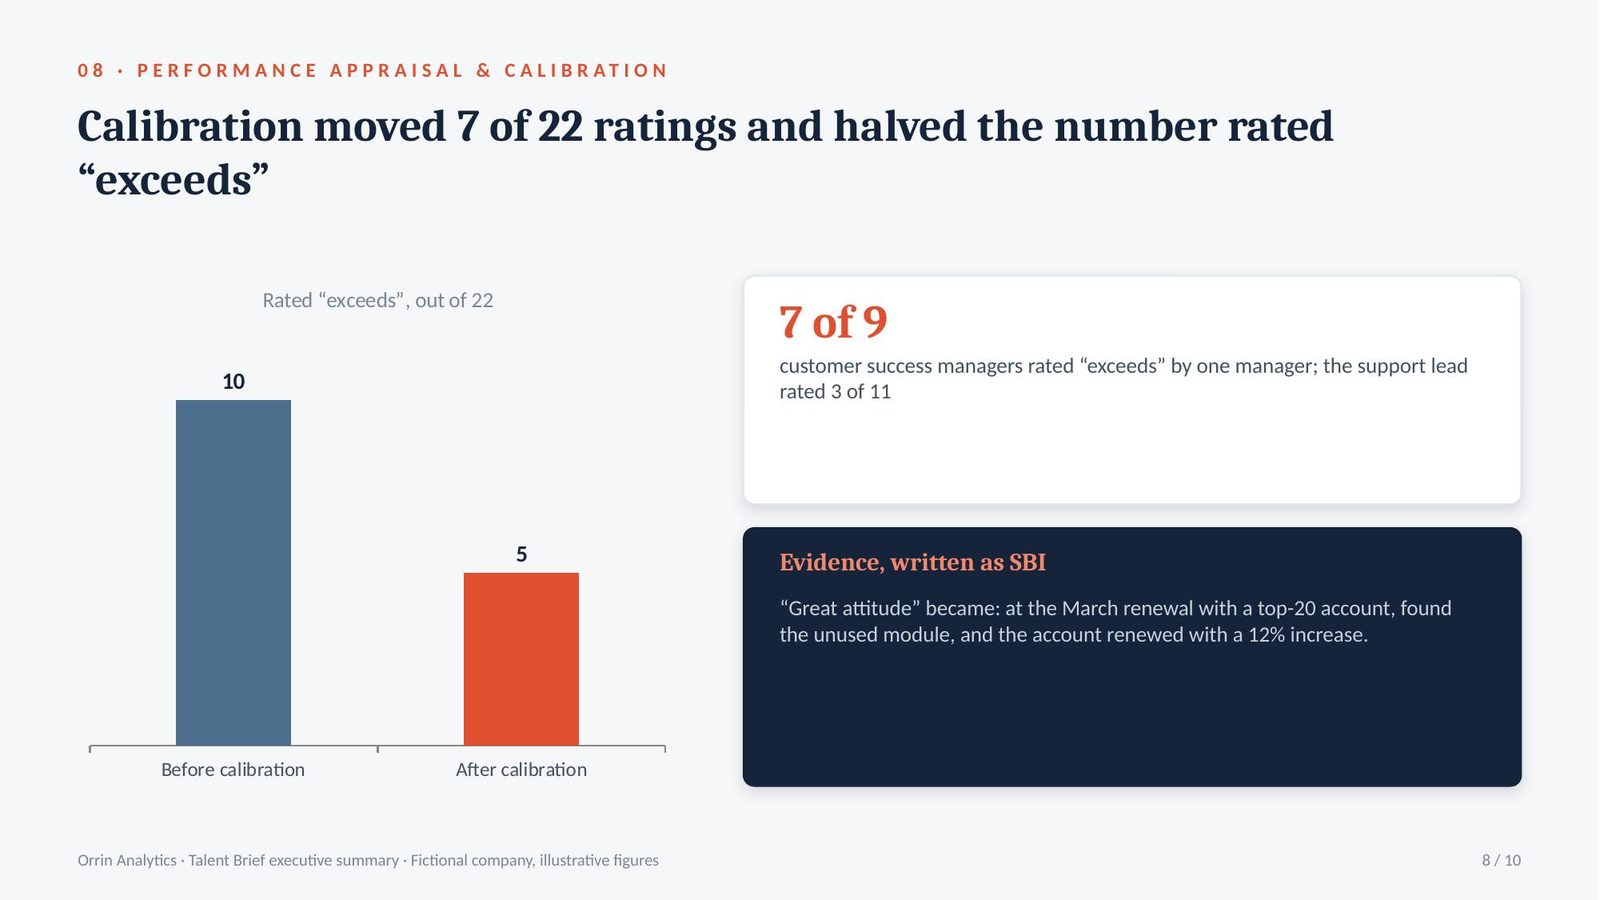
Calibration moved 7 of 22 ratings. “Exceeds” fell from 10 people to 5, and every rating now cites evidence written as situation, behaviour and impact.

Before calibration10 of 22 rated “exceeds”; 7 of them from one manager
After calibration5 of 22 rated “exceeds”; 7 ratings moved
SBI rewrite“great attitude” became a named renewal, the behaviour and the result
Team goalgross revenue retention from 91% to 94%

The analysis · When nearly everyone “exceeds”, the strongest performers see no difference and leave

Calibration is a meeting in which managers compare their draft ratings against the same standard before any rating is shared. SBI (Situation, Behaviour, Impact) is a way of writing feedback: where it happened, what the person did, and what it changed.

  • 7 of 9 “exceeds” from one manager: the customer success team lead rated 7 of 9 people “exceeds”; the support lead rated 3 of 11. The same results were being scored on two different scales.
  • 2 of 3 leavers named it: two of the three customer success managers who resigned said in exit interviews that there was no difference between strong and weak performers.
  • “Great attitude” is not evidence: rewritten as SBI, it became: at the March renewal with a top-20 account, found the unused module, and the account renewed with a 12% increase.

Takeaway: calibrate ratings across managers before sharing them, and require evidence written as situation, behaviour and impact for every rating.

Step 9 · Develop

Individual Development Plan (IDP) & 9-Box Talent Review

Places people on performance and potential, names successors for critical roles, and builds development plans.

9-box gridSuccession planning70-20-10 development

What Orrin brought · CEO

“If our new Head of Customer Success leaves, are we back where we started?”

What the prompt returned

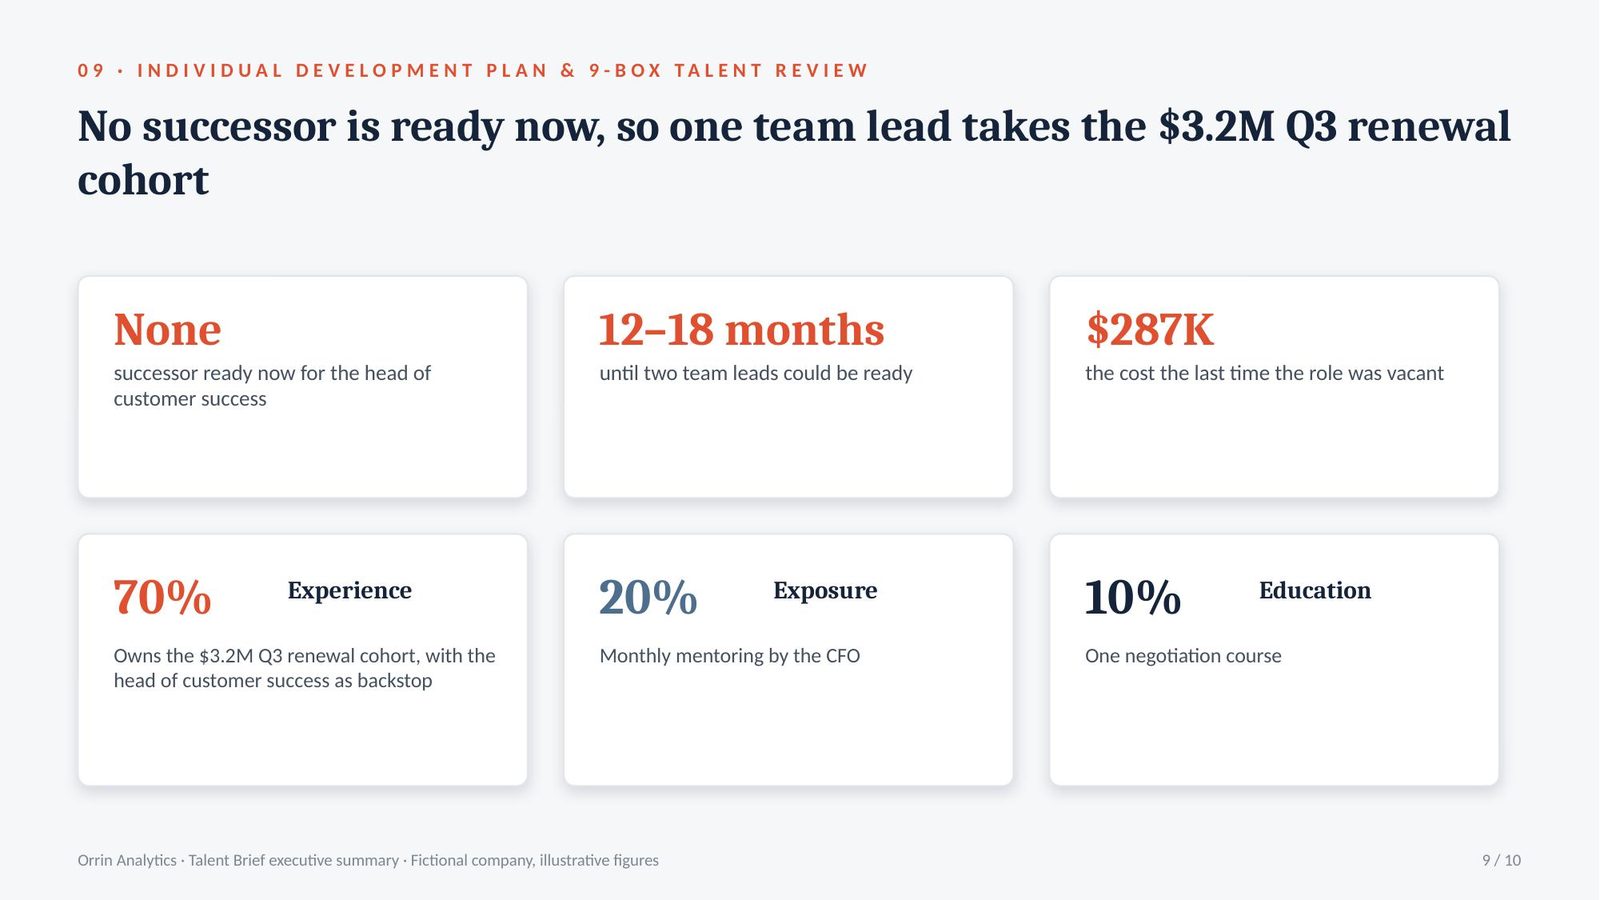
No successor ready now. Two team leads could be ready in 12 to 18 months; one development plan gives a lead the $3.2M Q3 renewal cohort.

Successor ready nownone
Ready in 12 to 18 months2 team leads: strong performance, medium potential
70% experienceowns the $3.2M Q3 renewal cohort
20% and 10%monthly mentoring by the CFO · one negotiation course

The analysis · With no successor, a second exit would repeat the $287K

A 9-box grid places each person on current performance and on potential, the evidence they can handle a larger role. The 70-20-10 model plans development as roughly 70% experience on the job, 20% learning from others and 10% formal training.

  • No successor, $287K exposure: if the new head of customer success left in year one, the role would go back to an external search and interim cover. The last time, that cost $287K.
  • Potential rated on scope, not presence: both team leads have held their roles under two years. The one given the stretch assignment has already run a renewal cohort of $1.1M without escalation.
  • 70% is the assignment: owning the $3.2M Q3 renewal cohort, with the head of customer success as backstop, tests the skill the succession gap needs. A course alone would not.

Takeaway: name a successor or a succession gap for every critical role, and build development plans around stretch assignments.

Step 10 · Retain

Retention Risk Analysis & Stay Interviews

Finds where people are likely to leave and why, costs the risk, and plans stay interviews while there is time to act.

Attrition analysisEngagement survey themesStay interviews

What Orrin brought · Head of People

“Here are the engagement survey comments and 18 months of leaver data.”

What the prompt returned

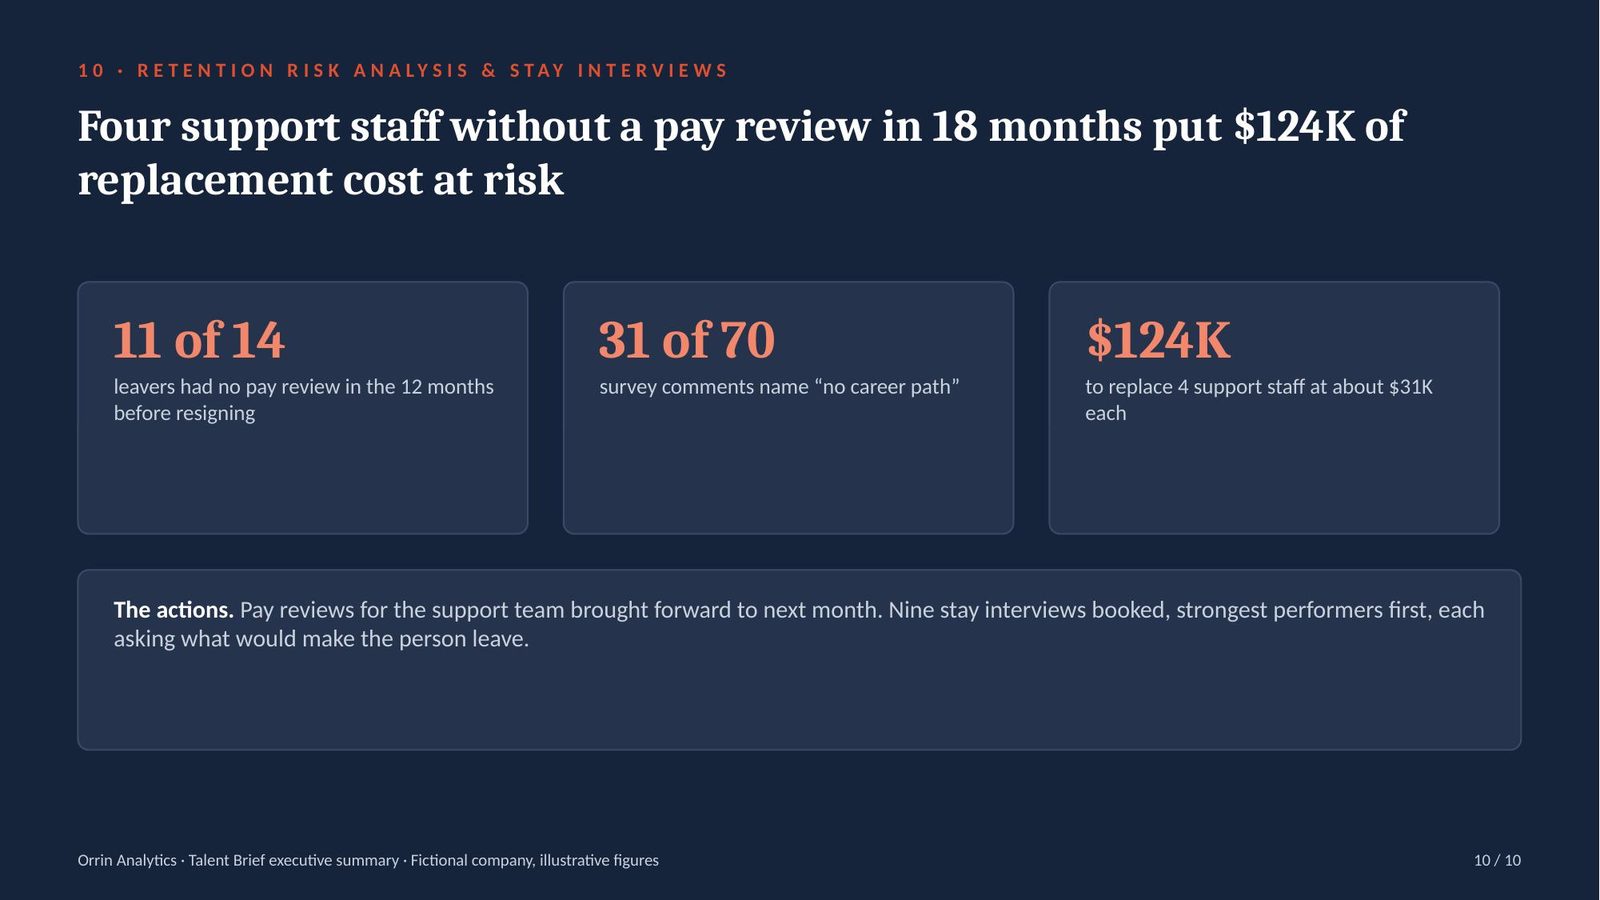
The risk is concentrated in one team: 4 of 11 support staff have had no pay review in 18 months. Replacing them would cost about $124K.

Leavers11 of 14 had no pay review in the 12 months before leaving
Survey theme“no career path” in 31 of 70 comments
Hotspotsupport team: 4 of 11 with no pay review in 18 months
Stay interviews9 booked, strongest performers first

The analysis · Time since the last pay review predicted leaving better than anything in the exit surveys

Retention risk analysis compares the people who left with the people who stayed, to find the factors that predict leaving. A stay interview asks a current employee what would make them leave and what would make them stay.

  • 11 of 14 leavers: had no pay review in the 12 months before they resigned. Exit surveys most often gave “career opportunity” as the reason.
  • 4 people, $124K: four of the 11 support staff have had no pay review in 18 months. Replacing one costs about half a $62K salary, $31K, so the four together cost $124K.
  • 31 of 70 comments: named no career path. Stay interviews start with the strongest performers in support, and the pay reviews are brought forward to next month.

Takeaway: bring forward pay reviews in the hotspot team, and hold stay interviews with the strongest performers there first.

The finale · what prompts 02, 04 and 07 produce

What the hiring team worked from

Three documents from Orrin’s Talent Brief: the job description from prompt 02, the interview scorecard from prompt 04, and the first 90 days from prompt 07.

Head of Customer Success

Reports to the COO · leads a team of 22 roles across customer success and support

Orrin Analytics
$180K–$210K base + variable

Why the role exists. Orrin’s net revenue retention has fallen from 108% to 97% and the team has lost 3 of its 9 customer success managers. This role rebuilds the team and brings retention back above 100%.

Outcome 1

Net revenue retention

97% → 105% by Q4 2027

Outcome 2

Customer success attrition

33% → under 15%

Outcome 3

Renewals due by March 2027

$11.5M, every account owned

Requirement, as a skill you can show usWhy it is here
Has led a customer success team of 8 or moreThe team is 9 customer success roles, 3 of them open, and 11 support staff
Has owned a retention number, and can show the before and afterOutcome 1 is a retention target
Has rebuilt a team after losses3 of 9 people have left in the last year
Can run renewal negotiations with finance buyers$11.5M renews in the first six months

Removed from the previous description

“10+ years in SaaS”, “MBA preferred” and “strategic leader”: none of them can be tested at interview, and none predicts the four outcomes.

Interview scorecard — Head of Customer Success

Same questions and the same 1–5 scale for every candidate · completed before the debrief

6 competencies · 12 questions
14 CVs screened · 5 interviewed

Knockout 1

Team of 8+

Has led a customer success team of 8 or more

Knockout 2

Owns retention

Has owned a retention number, with before and after

CV screen

5 of 14

pass both knockouts

Rejected

9

each with the missing evidence recorded

CompetencyOwnerQuestion135
Retention diagnosisCOO“Tell me about a quarter when retention fell. What did you change?”Describes the team’s effortNames the metric and one causeNames the metric, the cause and the result
Team leadership through changeHead of Talent“Tell me about a team you took over after people had left.”Describes hiring replacementsDescribes what was changed for the people who stayedShows attrition before and after, with the changes made
Renewal negotiationCFO“A top account asks for 20% off to renew. What do you do?”Offers a discountTrades terms before priceTests the reason, trades terms, and knows the walk-away

Scoring rule. One line of evidence for every score, and no overall recommendation until the debrief. Three more competencies, each with two questions, complete the scorecard.

Onboarding plan — first 90 days

For the new Head of Customer Success, agreed with the COO before day one

Weekly one-to-one with the COO
Reviews at day 30, 60 and 90

Days 1–30 Learn

One-to-ones with all 6 customer success managers

Before any change to the team

Meet the top 20 accounts

41% of revenue, $17.2M

Read the last 18 months of churn and renewal data

Input to the day-60 diagnosis

Days 31–60 Diagnose

Retention diagnosis to the executive team

Why net revenue retention fell from 108% to 97%

Account ownership reviewed

Every account has one named owner

Days 61–90 Deliver

Renewal plan for the $11.5M due by March

An owner and a date for each of the 96 accounts

Hiring plan for the 3 open roles

Using the prompt 02 and 04 process

Day-90 review, written before day one

Is there a renewal plan for the $11.5M due by March, with an owner for every account? Have all 6 customer success managers and the top 20 accounts been met? Has the retention diagnosis been presented?

Prompt output, formatted for this page. The prompts return the same content as text and tables; the figures come from whatever you paste in. Orrin Analytics is fictional, so every number here is ours to show you.

Pack 6 · HR & Talent

Ten prompt templates, one running brief

  • Workforce plan, job description and employer value proposition
  • Structured interview guide, selection decision and offer
  • Onboarding plan, performance appraisal and calibration
  • 9-box talent review, development plans and retention risk
  • Text file and formatted PDF · ChatGPT, Claude and Gemini

$15

One-time purchase · instant download

Get the pack

* Orrin Analytics, its people, candidates and all figures on this page are fictional and used for illustration only. Output from these prompts depends on the information you supply and the AI tool you use. Employment law differs by country; nothing here is legal advice.

Next step · the Presentation Generator

From the Talent Brief to a board deck

The pack ends with the documents above. The McKinsey-Grade PowerPoint Generator is a separate product, $19: paste the Talent Brief into it and it builds a board deck in Claude, as a real .pptx with native, editable charts.

Below is Orrin’s executive summary: ten slides, one for each prompt’s output, unedited.

Orrin Analytics Talent Brief executive summary, slide 1 of 10 Orrin Analytics Talent Brief executive summary, slide 2 of 10 Orrin Analytics Talent Brief executive summary, slide 3 of 10 Orrin Analytics Talent Brief executive summary, slide 4 of 10 Orrin Analytics Talent Brief executive summary, slide 5 of 10 Orrin Analytics Talent Brief executive summary, slide 6 of 10 Orrin Analytics Talent Brief executive summary, slide 7 of 10 Orrin Analytics Talent Brief executive summary, slide 8 of 10 Orrin Analytics Talent Brief executive summary, slide 9 of 10 Orrin Analytics Talent Brief executive summary, slide 10 of 10
1 / 10

Orrin Analytics is fictional, so every number here is ours to show you. Generated in the NOVA house style.

Microsoft PowerPoint Want the deck built for you in one shot? The McKinsey-Grade PowerPoint Generator — $19

Built in Claude as a real .pptx with native, editable charts. Or take both generators together in the bundle, $25.

Back to The Prompt Library