Ten AI prompt templates that run a real finance cycle — clean the base, explain the variance, forecast from drivers, find the cash, then face the board. Below, watch one company travel all ten.
The scenario
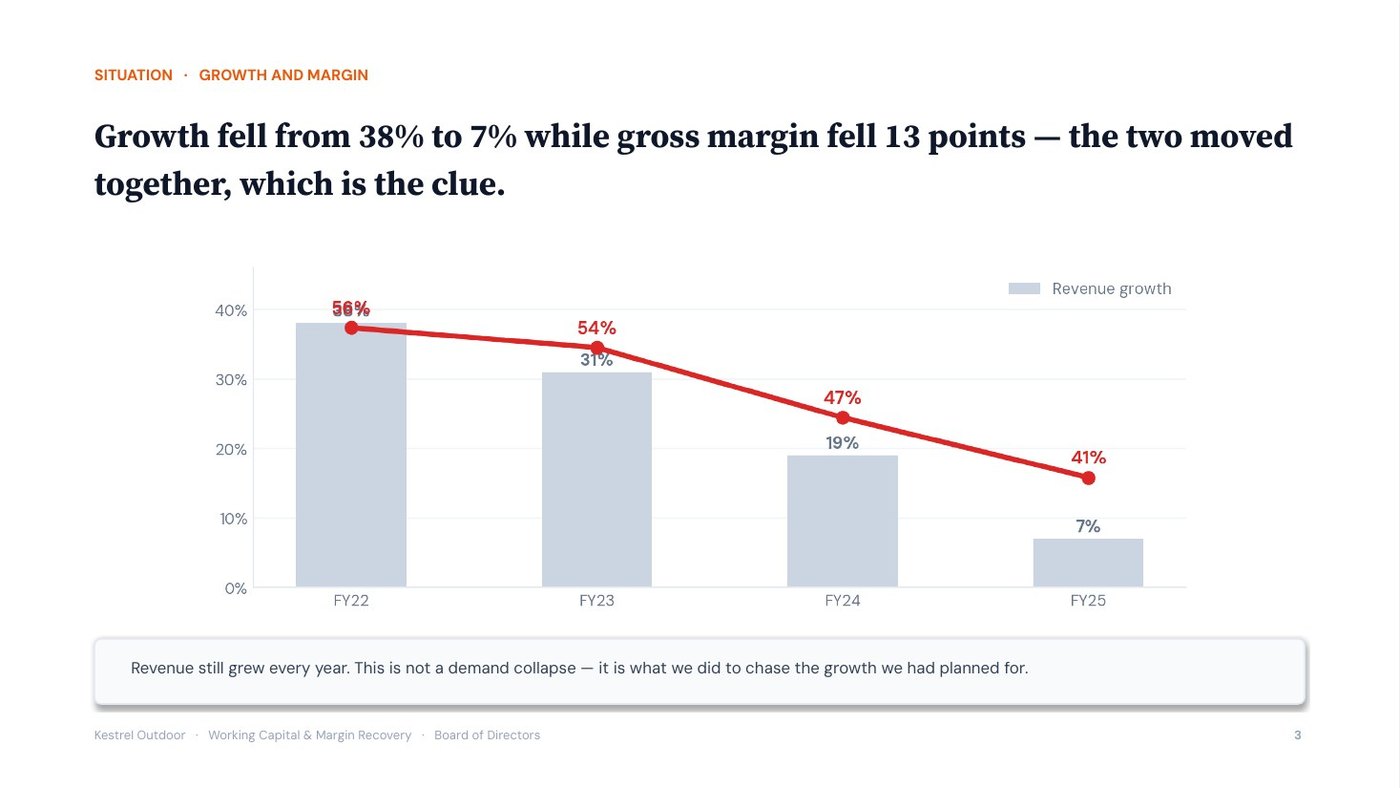
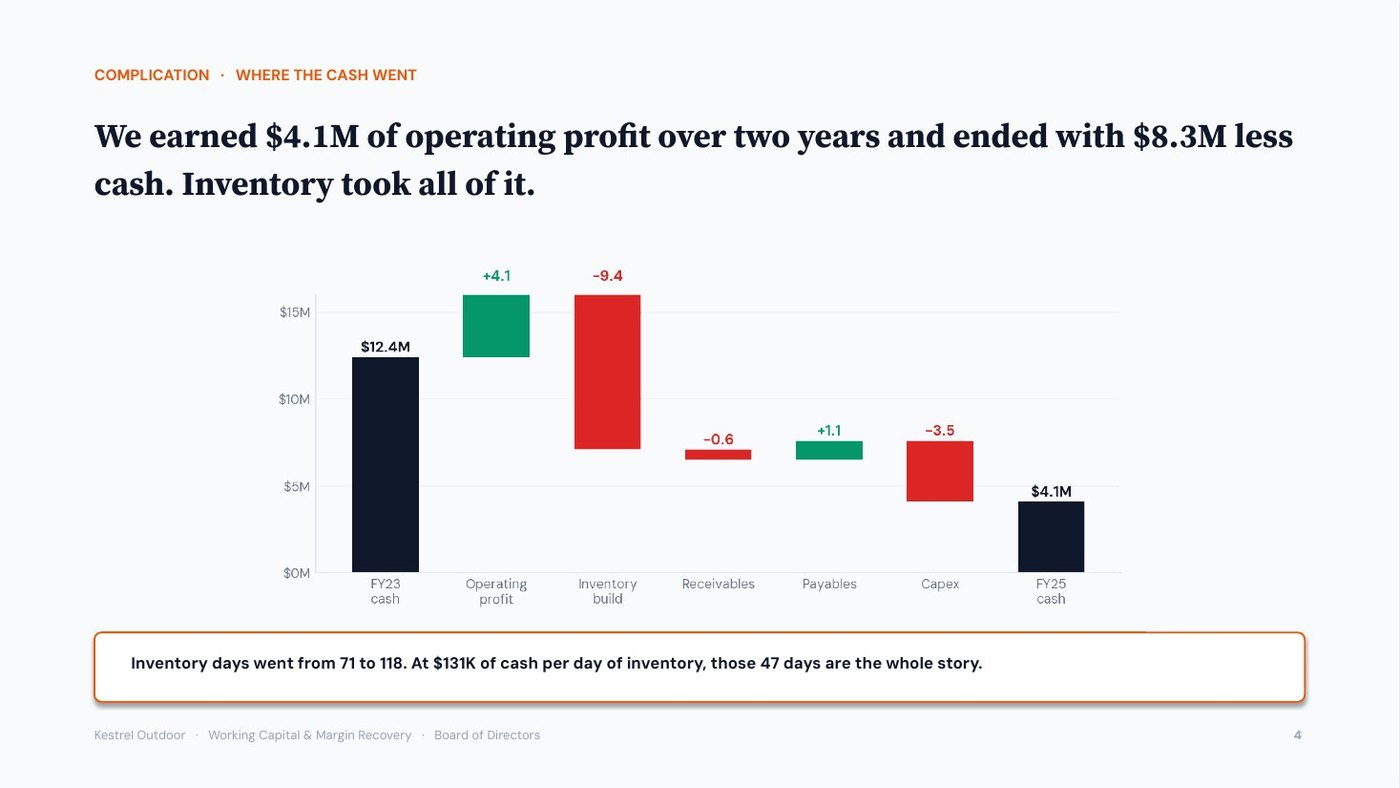
A direct-to-consumer outdoor equipment brand. $48M revenue, still growing, positive operating profit every quarter — and the cash has quietly disappeared. Growth has fallen from 38% to 7% and gross margin from 54% to 41%, and nobody agrees on why. Here is how the ten prompts take that from a pile of exports to a board decision — one step at a time.
The journey
Ten prompts, in order. Each one's output becomes the next one's input, building a single running Finance Brief.
Strips the one-offs and tests whether profit is actually becoming cash.
“$48M revenue, $3.1M EBITDA, and we are somehow out of cash.”
“Normalised EBITDA is $1.4M, not $3.1M. Cash conversion is 0.31.”
Every forecast is built on top of one year's numbers. Get that year wrong and every projection after it inherits the error. Kestrel's reported profit of $3.1M contained three things that will not happen again, and one that was never really a cost of the business.
Normalised — meaning stripped back to what repeats — the real figure is $1.4M, not $3.1M. Forecasting from the reported number would have made everything downstream wrong by more than double.
Finds out whether each sale makes money — by channel, not blended.
“AOV $184, blended CAC $71, 22% repeat rate.”
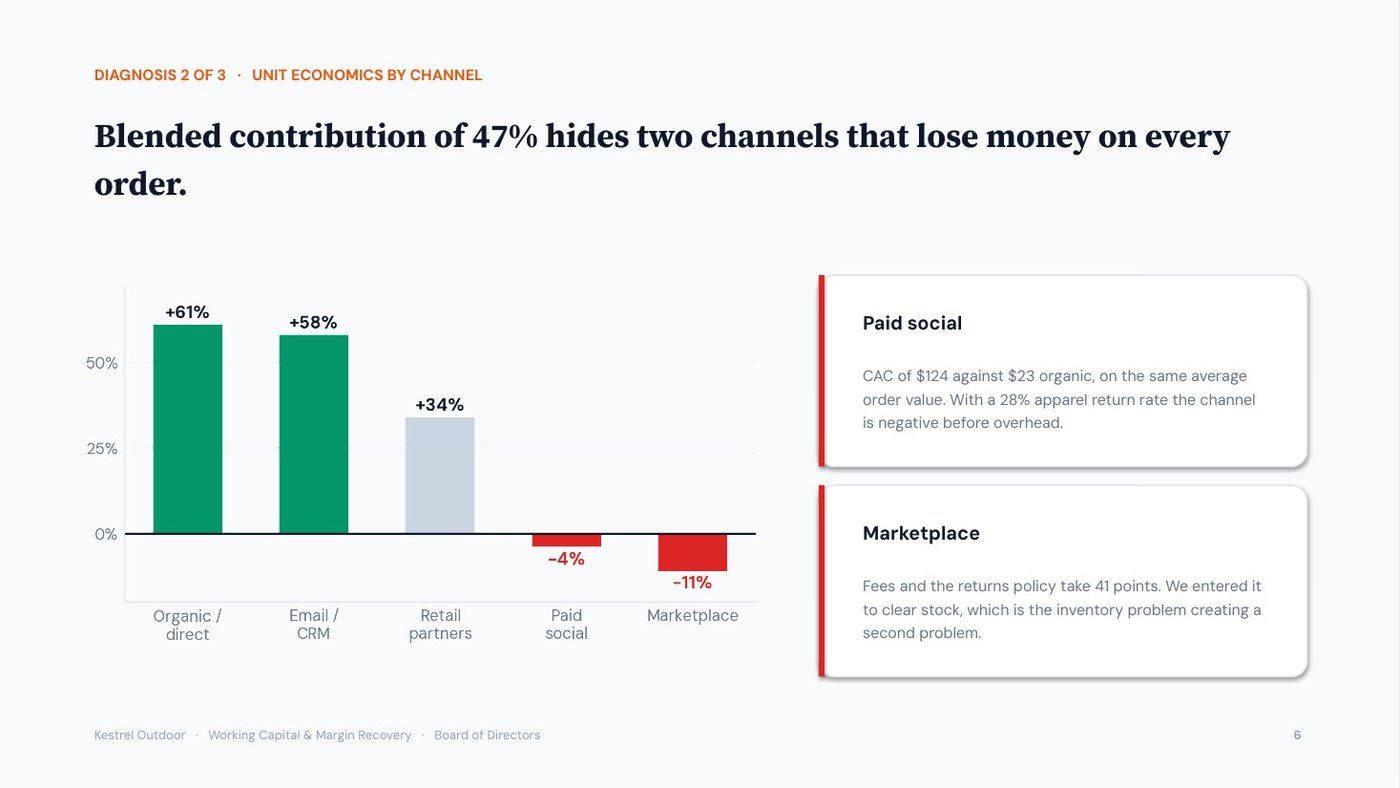
“Blended 47% contribution. Two of five channels are negative.”
Kestrel spends an average of $71 to win one customer. That is its acquisition cost, and the average looks healthy. Split by channel it is $23 through organic search and $124 through paid social — on the same $184 average order.
The verdict is not “the unit economics work.” It is “they work on three channels out of five, and most of the budget is going to the other two.”
Decomposes the miss into volume, price, mix and rate — and checks it sums.
“We came in $2.4M under budget and margin dropped 13 points.”
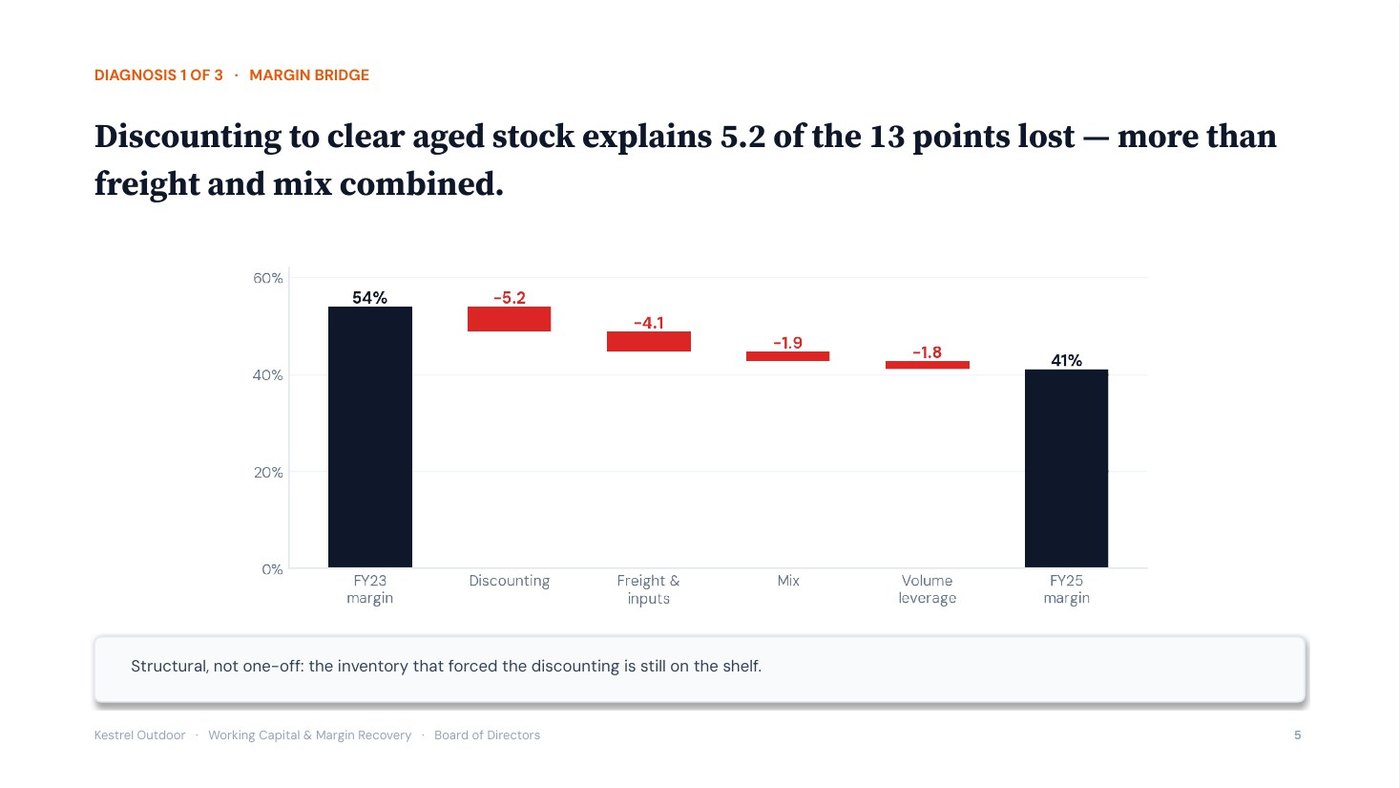
“Discounting explains 58% of the margin gap — and it is structural.”
“We missed budget by 8%” is not an explanation. A variance bridge breaks that gap into its causes and puts a number on each, so the conversation moves from blame to arithmetic.
It then tests the explanation the user arrived with. Kestrel believed it was a freight problem. Partly right, mostly wrong.
Finds the SKUs and segments that quietly destroy value.
“64 SKUs, five channels, and one P&L that shows all of it as one number.”
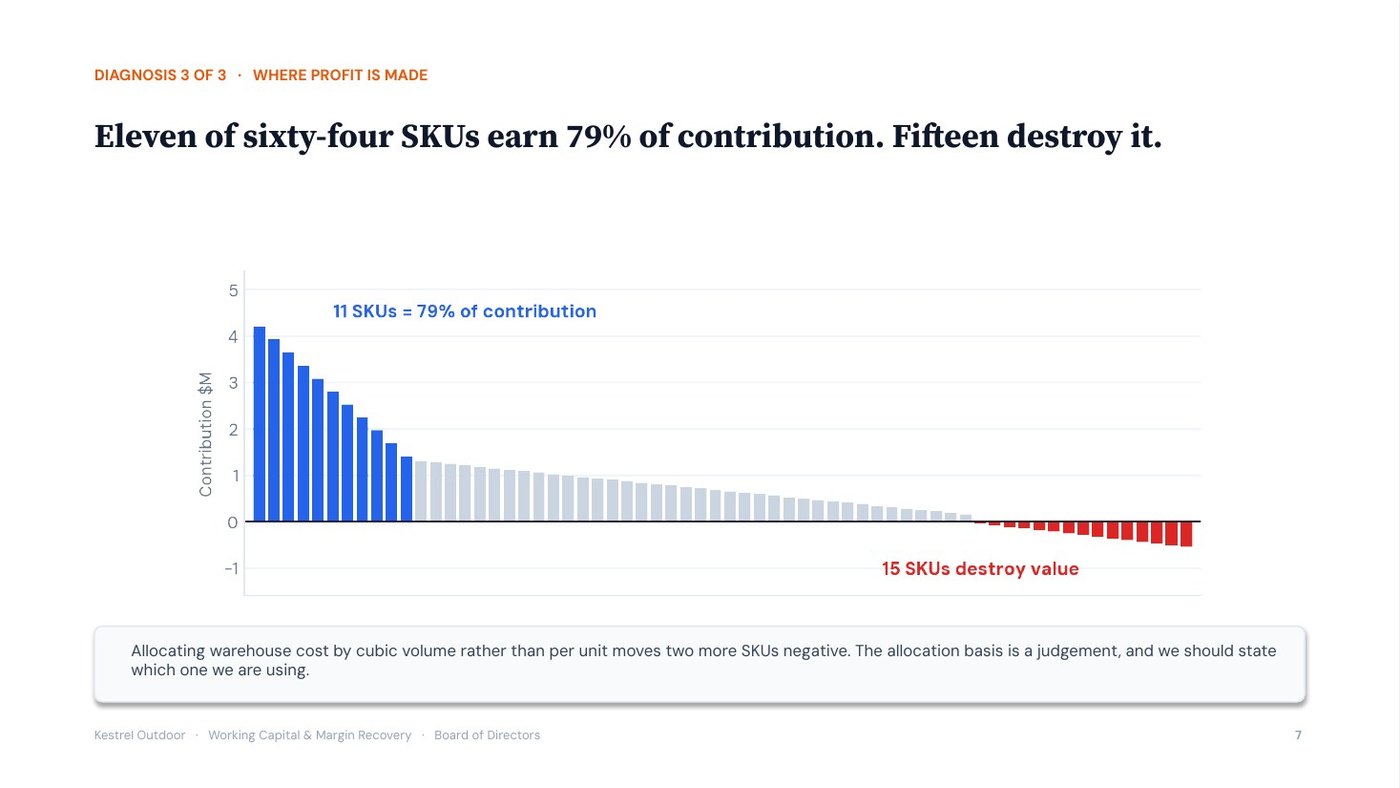
“11 SKUs earn 79% of contribution. 15 destroy it.”
Kestrel sells 64 different products — SKUs, in retail language, each one a separately stocked item. Reported together they look like one business. Ranked by the profit each actually contributes, eleven of them earn 79% of it and fifteen lose money.
Verdict: a mix problem, not a pricing problem. Those need completely different fixes.
Builds the forecast from operating drivers instead of last year plus a percentage.
“Plan says 18% growth next year. Where does that come from?”
“Sessions × conversion × AOV × repeat. Conversion decides it.”
“We will grow 18% next year” is not an assumption, it is a result. A driver tree breaks that result into the handful of things an operator can actually influence, so every number in the forecast can be traced back to a decision someone makes.
Three things then get watched monthly — acquisition cost, four-week repeat rate, returns — so the forecast breaks early and cheaply rather than late and publicly.
Builds the integrated model — and reports the checks it fails.
“Build me three years, P&L, balance sheet and cash flow.”
“FAIL: closing cash is $2.1M below the balance sheet. Here is why.”
A company's finances are described by three connected reports. The profit and loss shows what was earned, the balance sheet shows what is owned and owed, and the cash flow shows what actually moved. Because they describe the same events, they must agree — and when they do not, an assumption is wrong.
It also predicted the challenge: why would stock move 40 days faster next year when it moved 47 days slower last year? Nobody had an answer.
Models cash weekly, names the breach, and finds the binding constraint.
“We have $4.1M. Payroll is the 15th. Are we fine?”
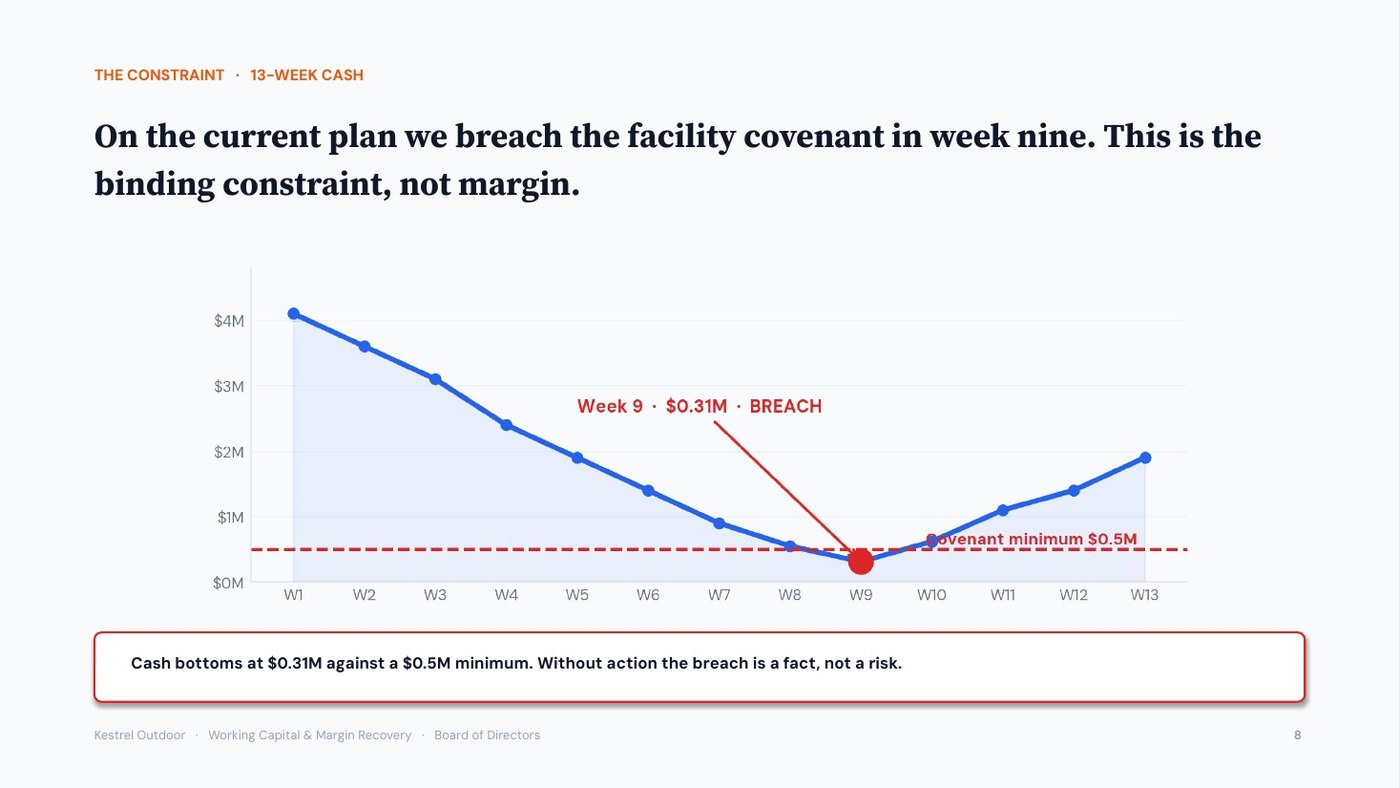
“No. Week 9, $0.31M, against a $0.5M covenant.”
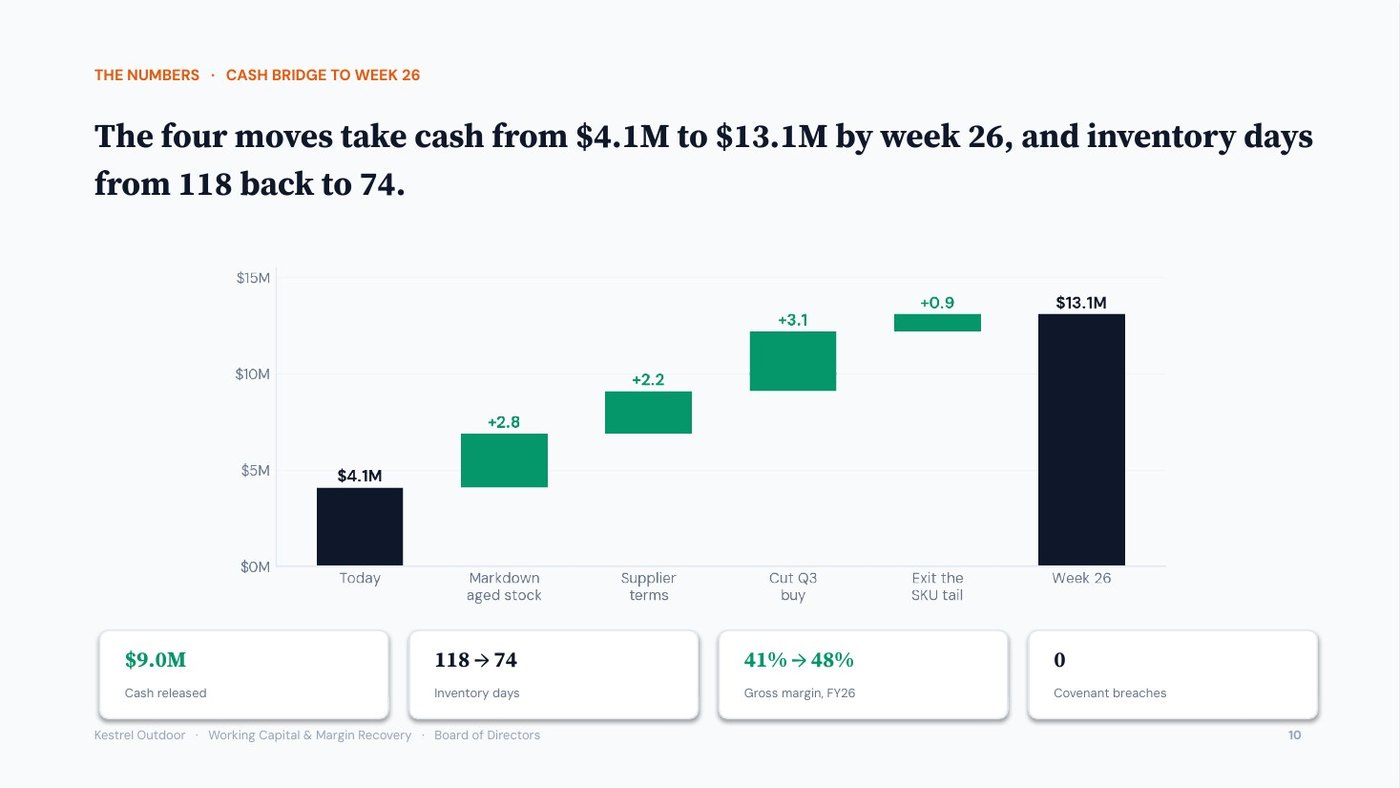
Kestrel is profitable and nine weeks from running out of money. Those are not contradictory, and the thirteen-week view is where the difference shows up — because payroll happens on a date, not in an average month.
The breach is stated in the first line of the answer, not buried in week nine of a table.
Appraises the spend properly — including the option of not spending it.
“$4.1M for warehouse automation. Finance says it pays back.”
“NPV $1.9M at a 12% hurdle. Or $2.6M if you count the unbankable.”
$4.1M spent today buys money that arrives over years, and money later is worth less than money now. Discounting future cash back to today's value gives the net present value — here $1.9M, meaning the project is worth $1.9M more than doing nothing.
It also names the break point: this works as long as the throughput gain exceeds 71% of projection. More useful to a committee than a single number.
Finds the value at which the plan stops working — and pre-commits the response.
“Give me a bear case for the recovery plan.”
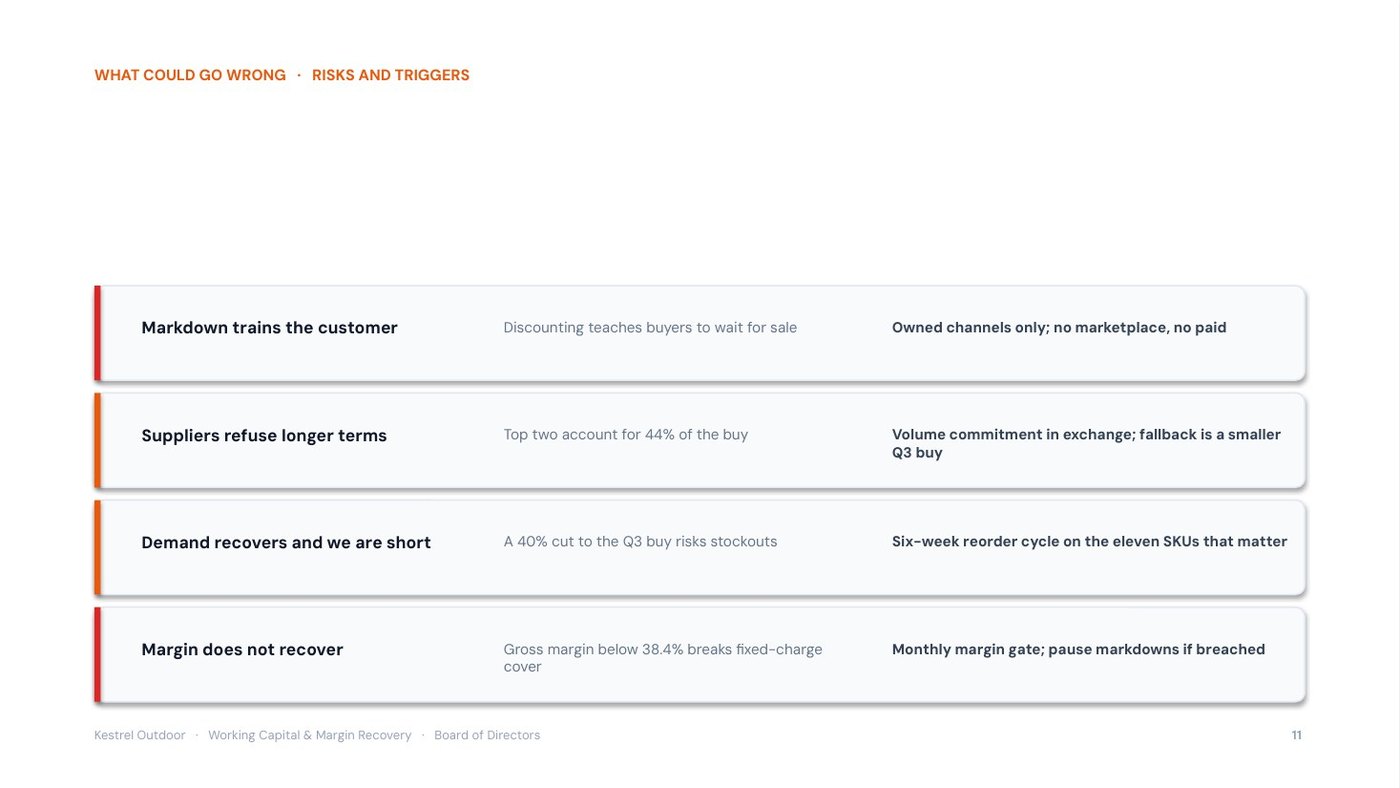
“Gross margin below 38.4% breaks fixed-charge cover. Month seven.”
Most downside scenarios are comfortable ones. Sales fall, costs helpfully fall too, and the business survives on paper. In a real downturn the damaging things arrive together, and the prompt is instructed to move them together.
The prompt assigns probabilities to each scenario and then says plainly how little confidence to place in its own probabilities, which is the honest position.
Turns the numbers into the story, the ask, and the questions you will be asked.
“Board is Thursday. I have forty tabs and no narrative.”
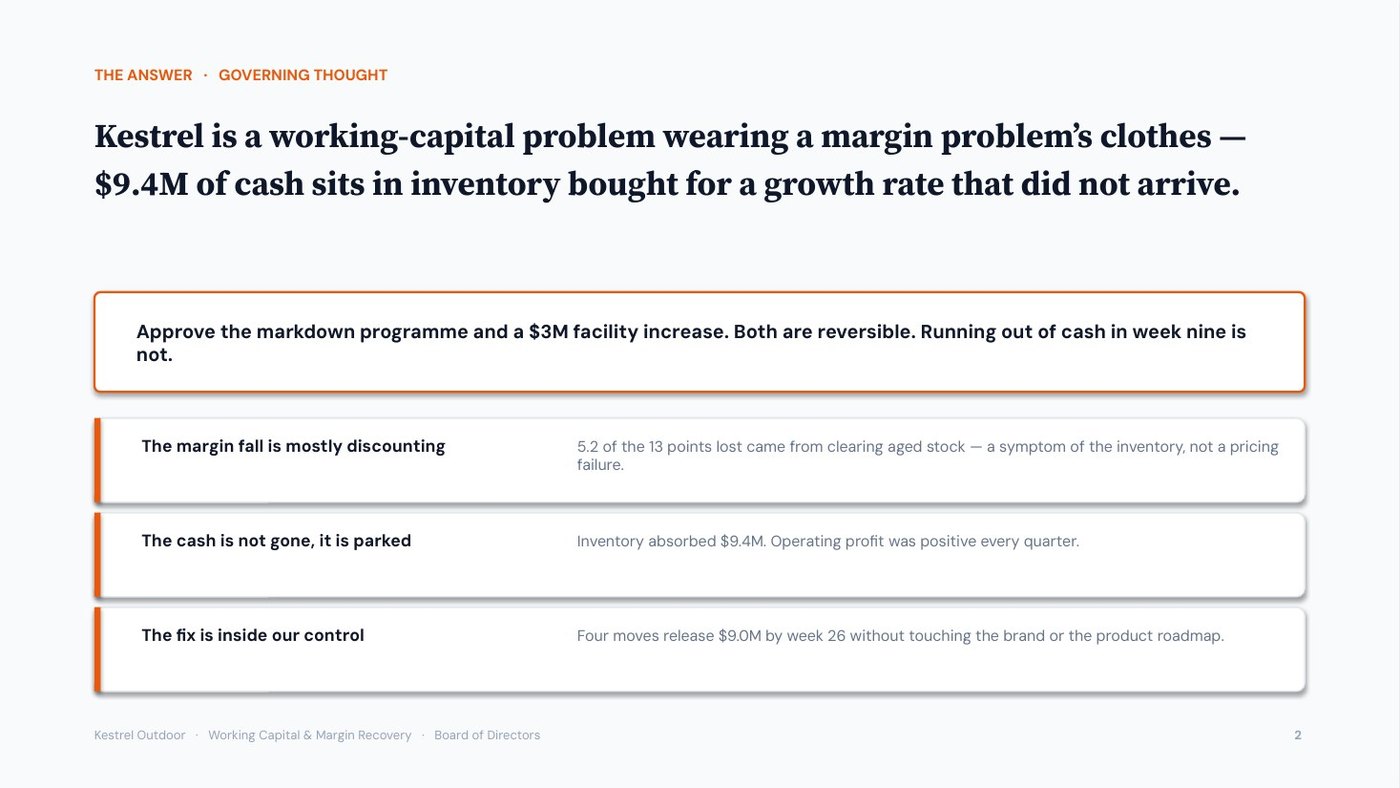
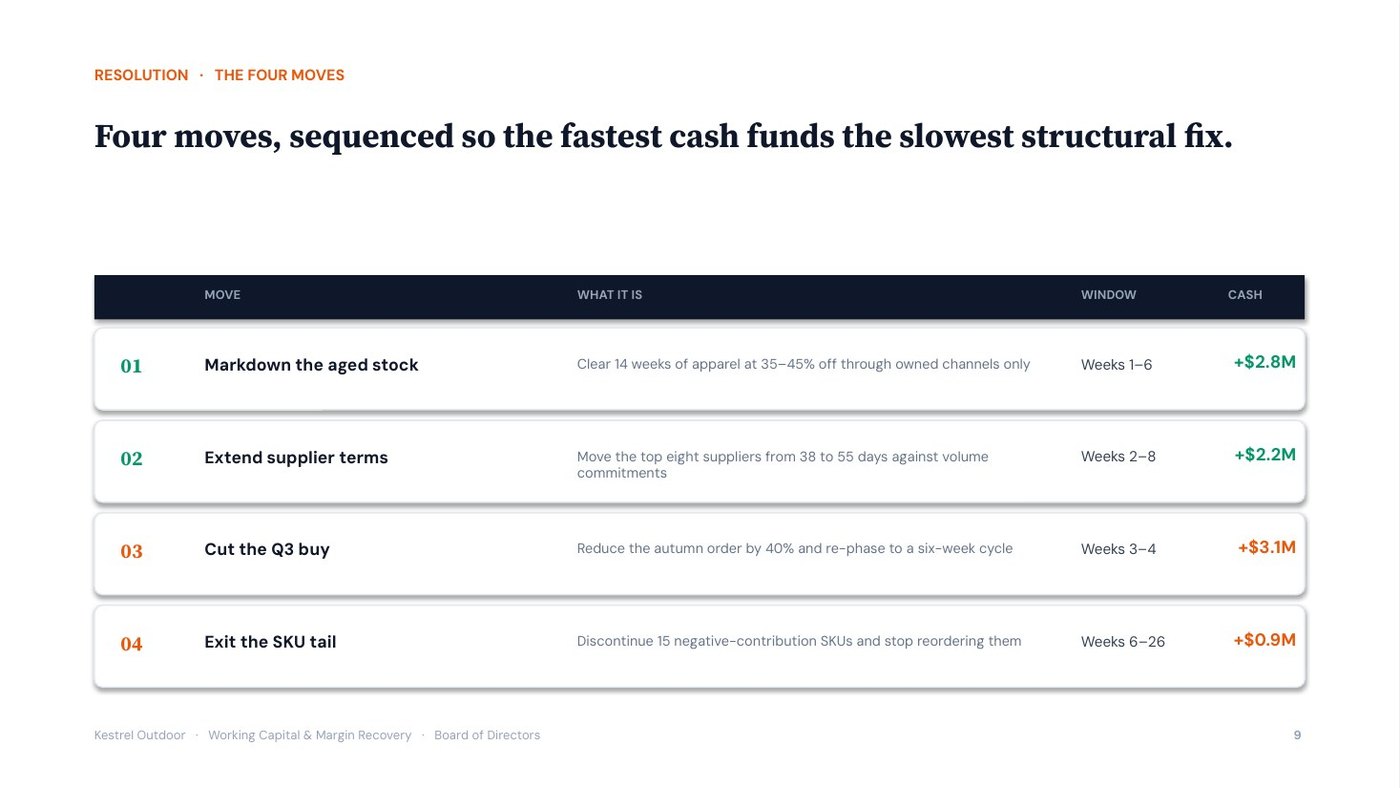
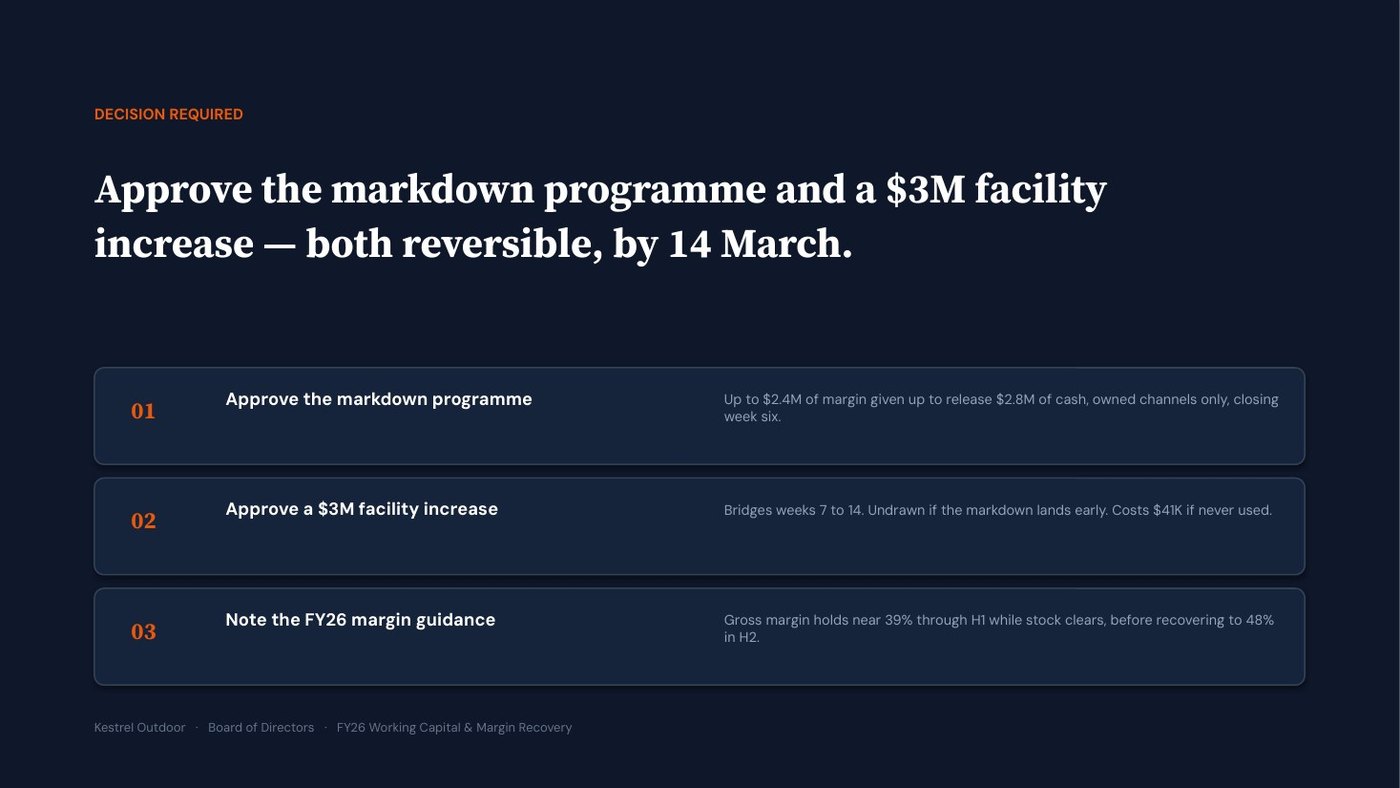
“A working-capital problem wearing a margin problem’s clothes.”
Boards do not read financial statements, they read the story and then attack it. The prompt builds both halves, and the second half is the one people skip.
It also names the single figure most likely to get challenged and prepares its full derivation. For Kestrel it guessed right — why did you buy the inventory?
All 10 prompt templates with full copy-paste text and worked examples — a downloadable PDF plus a plain-text copy file. Lifetime updates.
Instant download · lifetime updates
The ten prompts above produce the analysis: the clean base, the bridges, the forecast, the cash picture and the narrative. That is the hard part, and it is what this pack delivers.
Feed the Brief into the McKinsey-Grade PowerPoint Generator — our standalone flagship — and it builds this in Claude: a real .pptx with native, editable charts. Twelve slides, unedited.
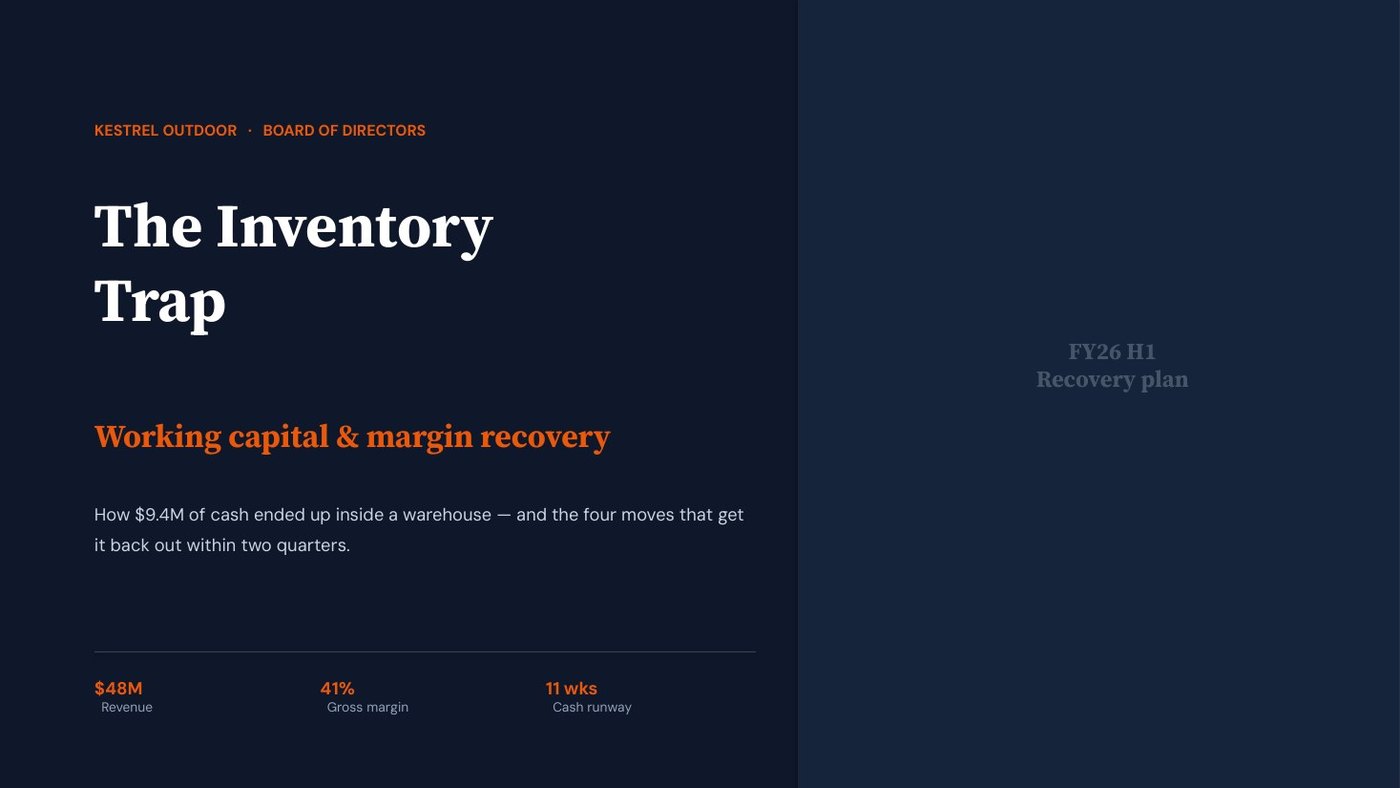
Kestrel Outdoor is a fictional company, so every number here is ours to show you. Generated in the NOVA house style.
Built in
as a real .pptx with native, editable charts. Or take both generators together in the bundle, $25.