Prompt LibraryFinance & Analysis
Prompts for Work · Pack 2

Finance & Analysis
AI Prompt Templates

Ten AI prompt templates that run a real finance cycle: clean the base, explain the variance, forecast from drivers, find the cash, then face the board. Below, one company is worked through all ten.

$15 · 10 prompt templates · lifetime updates
Get the pack — $15 Jump to the finale ↓

What’s inside

The 10 prompts in this pack

Run any prompt on its own, or run all ten in order. Each output feeds the next, building one Finance Brief.

The scenario

Kestrel Outdoor: profitable, growing, and nine weeks from a covenant breach

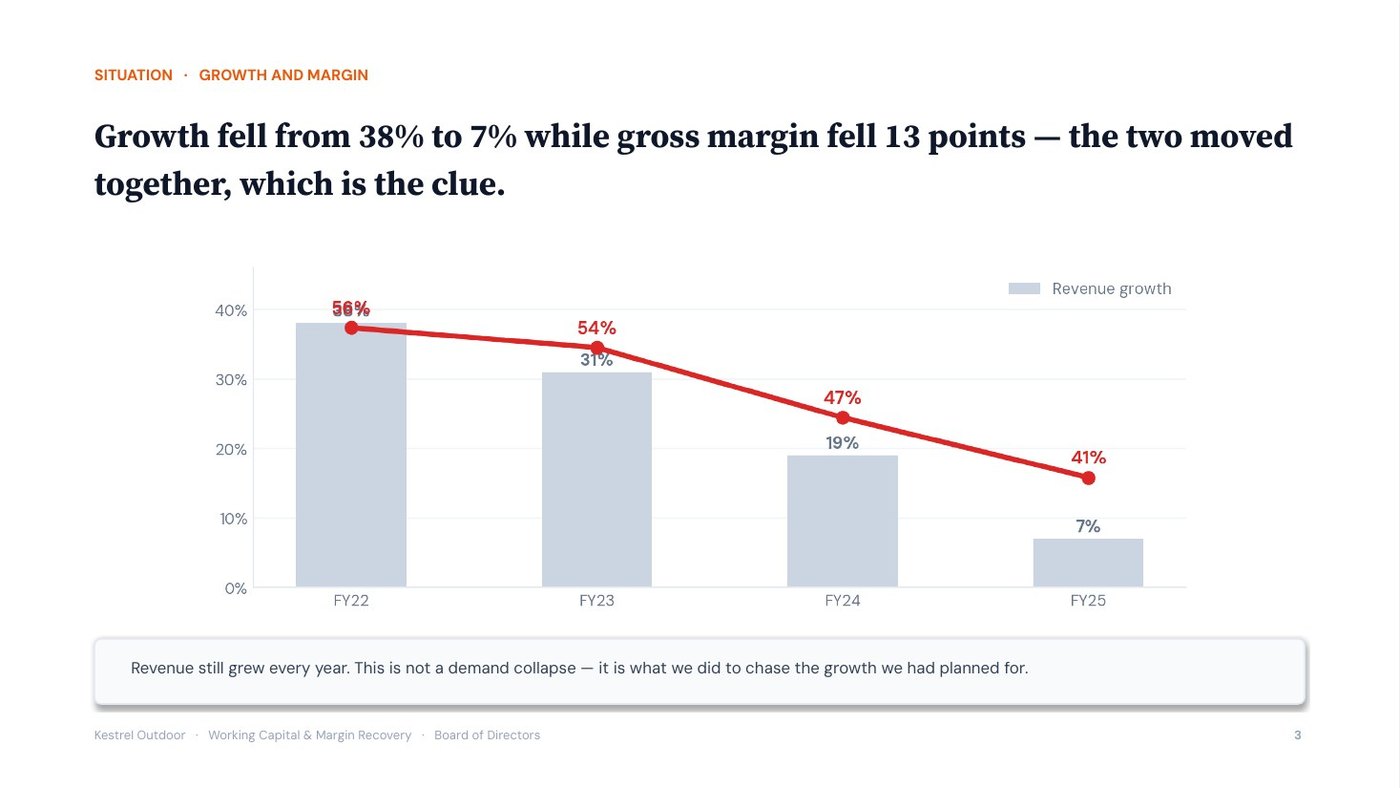
A direct-to-consumer outdoor equipment brand. $48M revenue, still growing, positive operating profit every quarter — and the cash has quietly disappeared. Growth has fallen from 38% to 7% and gross margin from 54% to 41%, and nobody agrees on why. Here is how the ten prompts take that from a pile of exports to a board decision — one step at a time.

$48Mrevenue
41%gross margin, from 54%
11 wkscash runway

Step by step

Input → what the prompt does → output

Ten prompts, in order. Each one's output becomes the next one's input, building a single running Finance Brief.

1
Baseline

Quality of Earnings Analysis

Strips the one-offs and tests whether profit is actually becoming cash.

Normalised Earnings Bridge · Quality of Earnings
What Kestrel brought · CFO

“$48M revenue, $3.1M EBITDA, and we are somehow out of cash.”

What the prompt returned

“Normalised EBITDA is $1.4M, not $3.1M. Cash conversion is 0.31.”

Amazon settlement booked as revenue — −$0.9M
Founder salary above market, added back — +$0.4M
Content spend capitalised, really marketing — −$1.2M
Normalised EBITDA — $1.4M
The analysis · Kestrel’s normalised EBITDA is $1.4M, not the reported $3.1M

A quality-of-earnings review adjusts reported profit to remove one-off and misclassified items, giving normalised EBITDA: earnings before interest, tax, depreciation and amortisation from repeatable operations. Every forecast should start from this figure.

  • One-off income: a $0.9M Amazon settlement was recorded as revenue, although no customer bought anything.
  • Misclassified cost: $1.2M of photography and video was recorded as an asset. It is marketing spend and should be an expense.
  • Owner pay: the founder is paid $0.4M more than a market salary for the role, so the excess is added back. $3.1M − $0.9M − $1.2M + $0.4M = $1.4M.
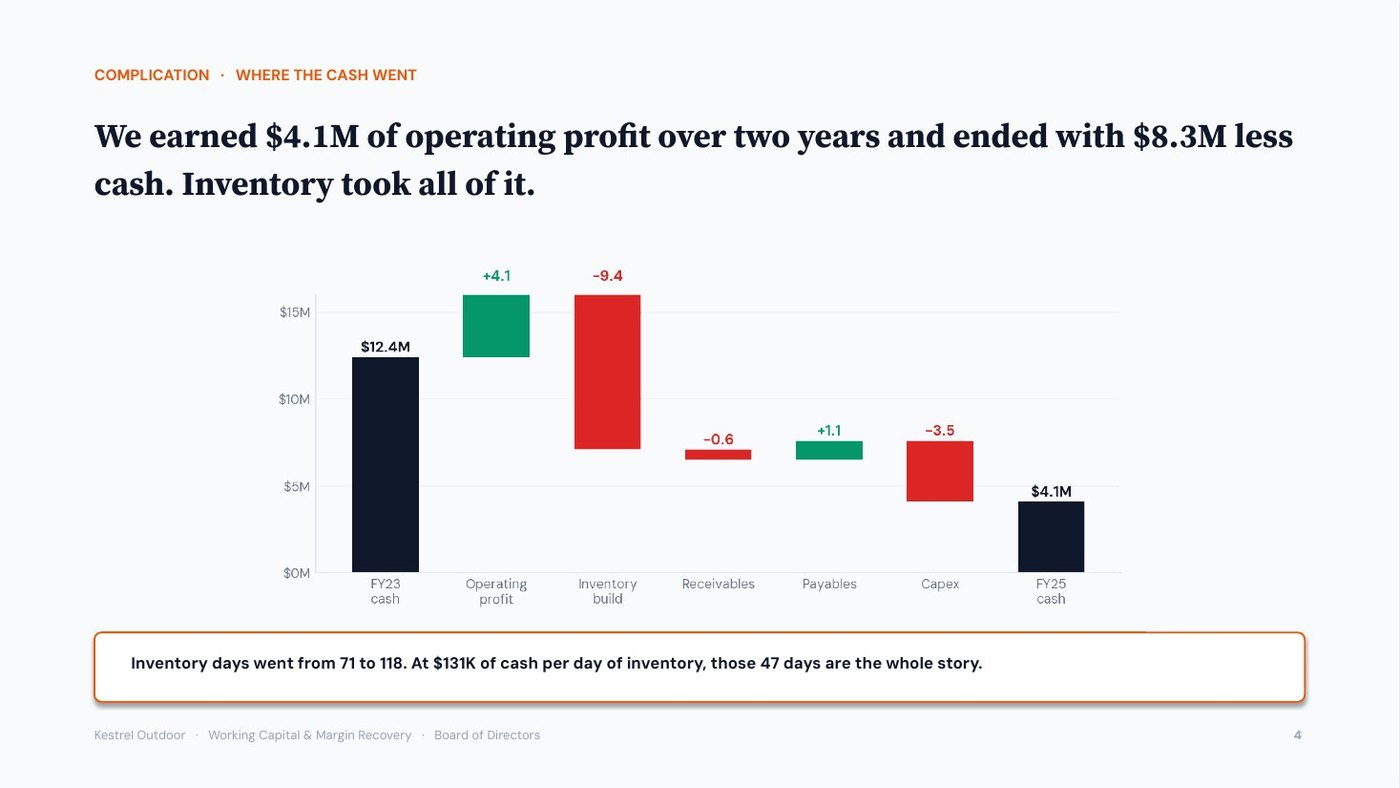
  • Cash conversion: only 31 cents of cash arrived for every dollar of reported profit. The difference went into unsold stock.

Takeaway: build the forecast on normalised EBITDA. Starting from the reported $3.1M would overstate every projection by more than double.

2
Baseline

Unit Economics & Contribution Margin

Finds out whether each sale makes money — by channel, not blended.

Contribution Margin · CAC Payback · LTV/CAC
What Kestrel brought · Head of Growth

“AOV $184, blended CAC $71, 22% repeat rate.”

What the prompt returned

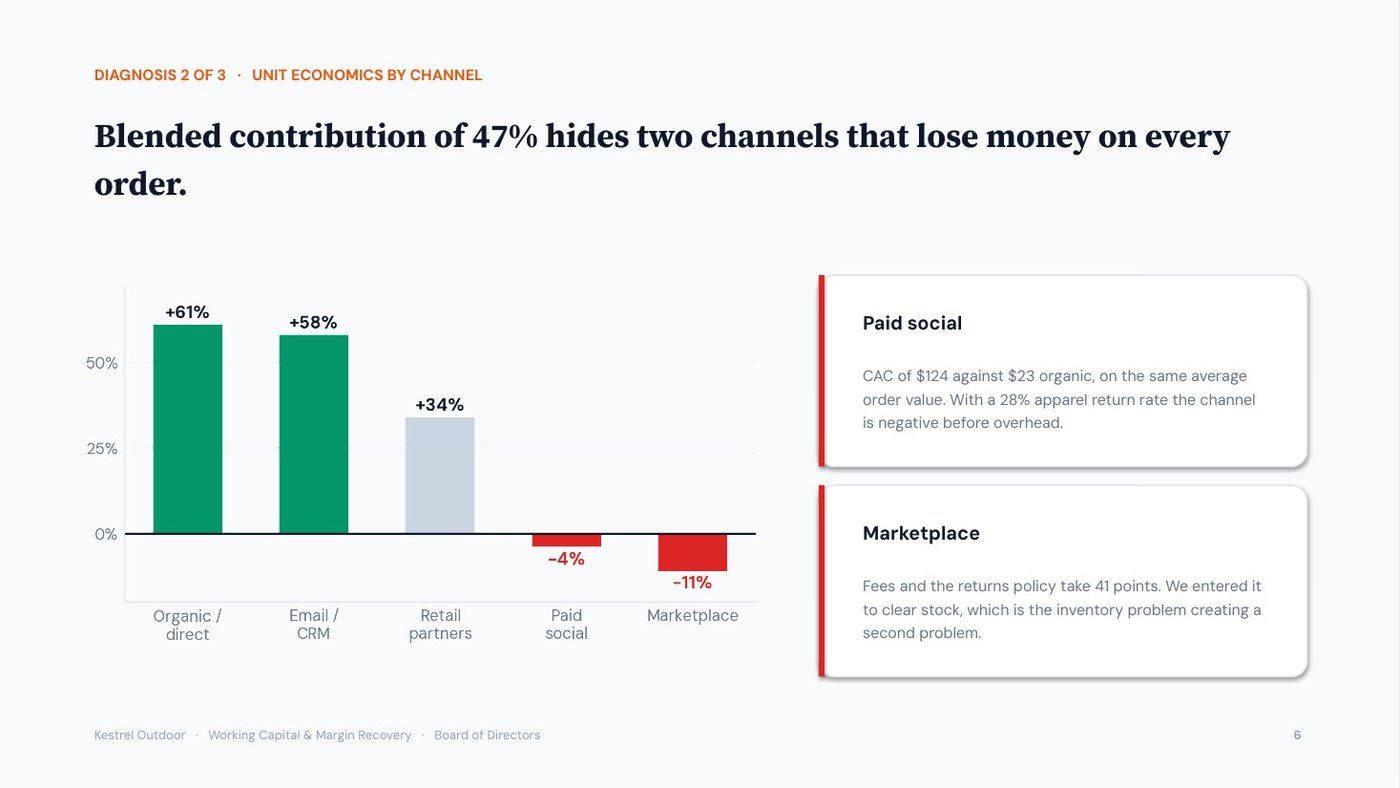
“Blended 47% contribution. Two of five channels are negative.”

Organic / direct — +61%
Email / CRM — +58%
Retail partners — +34%
Paid social — −4%
Marketplace — −11%
The analysis · Two of Kestrel’s five sales channels lose money on every order

Unit economics measures the profit or loss on a single sale. The key measure is contribution margin: revenue minus the costs caused directly by that sale, such as product cost, shipping and payment fees.

  • Average across channels: Kestrel keeps $87 on a $184 average order value (AOV), a 47% contribution margin.
  • By channel: customer acquisition cost (CAC), the marketing cost of winning one customer, is $23 through organic search and $124 through paid social. After returns, paid social runs at −4% and marketplace at −11%.
  • LTV/CAC: customer lifetime value divided by acquisition cost. At 2.1, a customer brings in about twice what they cost to acquire, but this depends on an unconfirmed retention rate.

Takeaway: move budget from paid social and marketplace to the three channels that make money.

3
Diagnose

Price-Volume-Mix Variance Analysis

Decomposes the miss into volume, price, mix and rate — and checks it sums.

Price/Volume/Mix Bridge · One-off vs Structural
What Kestrel brought · CFO

“We came in $2.4M under budget and margin dropped 13 points.”

What the prompt returned

“Discounting explains 40% of the margin gap — and it is structural.”

Volume — −$3.1M
Price — +$0.9M
Mix — −$0.2M
Sums to variance — −$2.4M ✓
The analysis · Discounting is the largest cause of Kestrel’s margin decline

Variance analysis explains the difference between budgeted and actual results. A price-volume-mix bridge splits a revenue variance into volume (units sold), price and mix (which products sold), and the parts must add up to the total.

  • Revenue variance: volume −$3.1M, price +$0.9M and mix −$0.2M add up to the $2.4M shortfall.
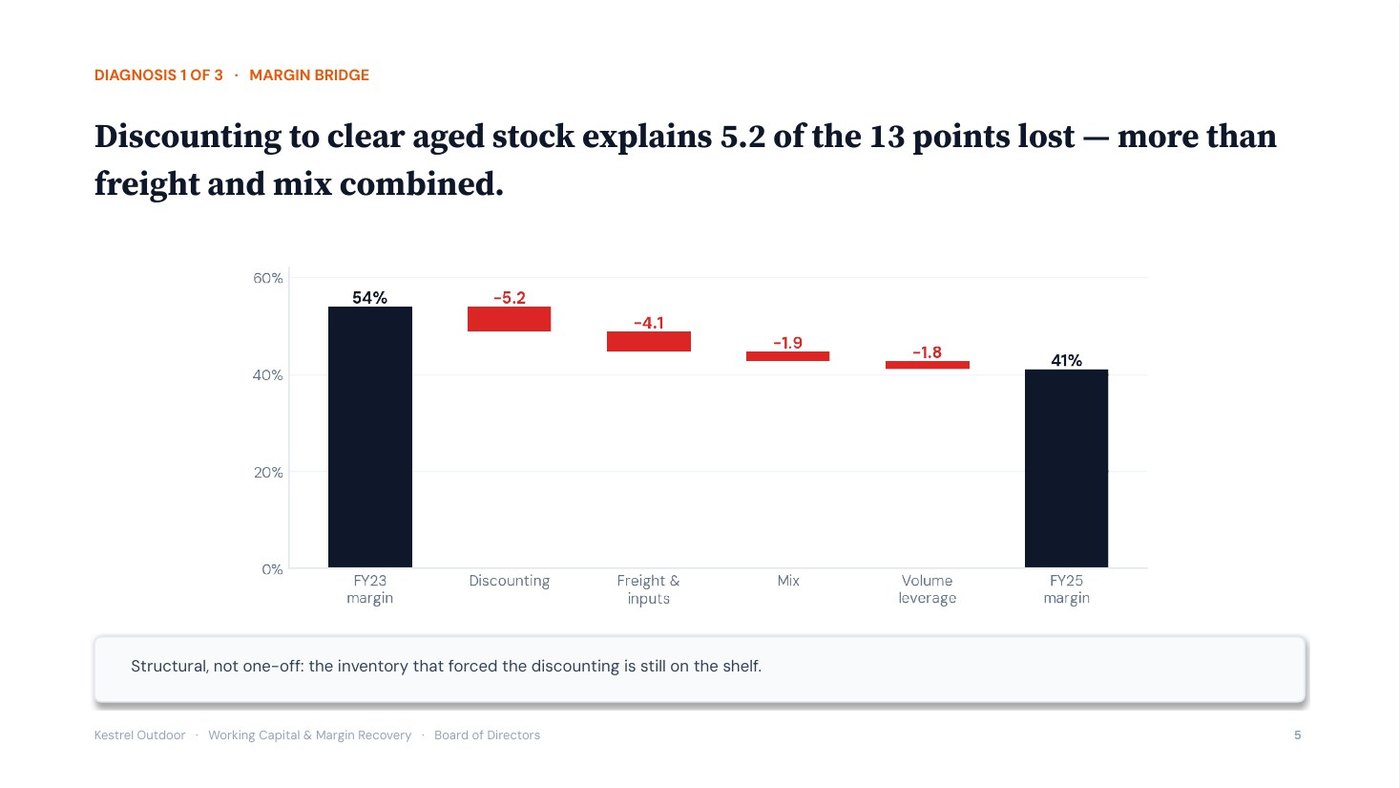
  • Margin variance: of 13 points of gross margin lost, discounting caused 5.2, freight and a supplier change 4.1, mix 1.9, and lower volume over fixed costs 1.8.
  • One-off or structural: a structural cause continues into the next quarter. The discounting is structural, because the excess stock that causes it is still in the warehouse.

Takeaway: treat discounting as an ongoing margin problem rather than a freight issue, and reduce the excess stock that causes it.

4
Diagnose

Product & Channel Profitability Analysis

Finds the SKUs and segments that quietly destroy value.

Contribution Ranking · Operating Leverage · Allocation Test
What Kestrel brought · Finance manager

“64 SKUs, five channels, and one P&L that shows all of it as one number.”

What the prompt returned

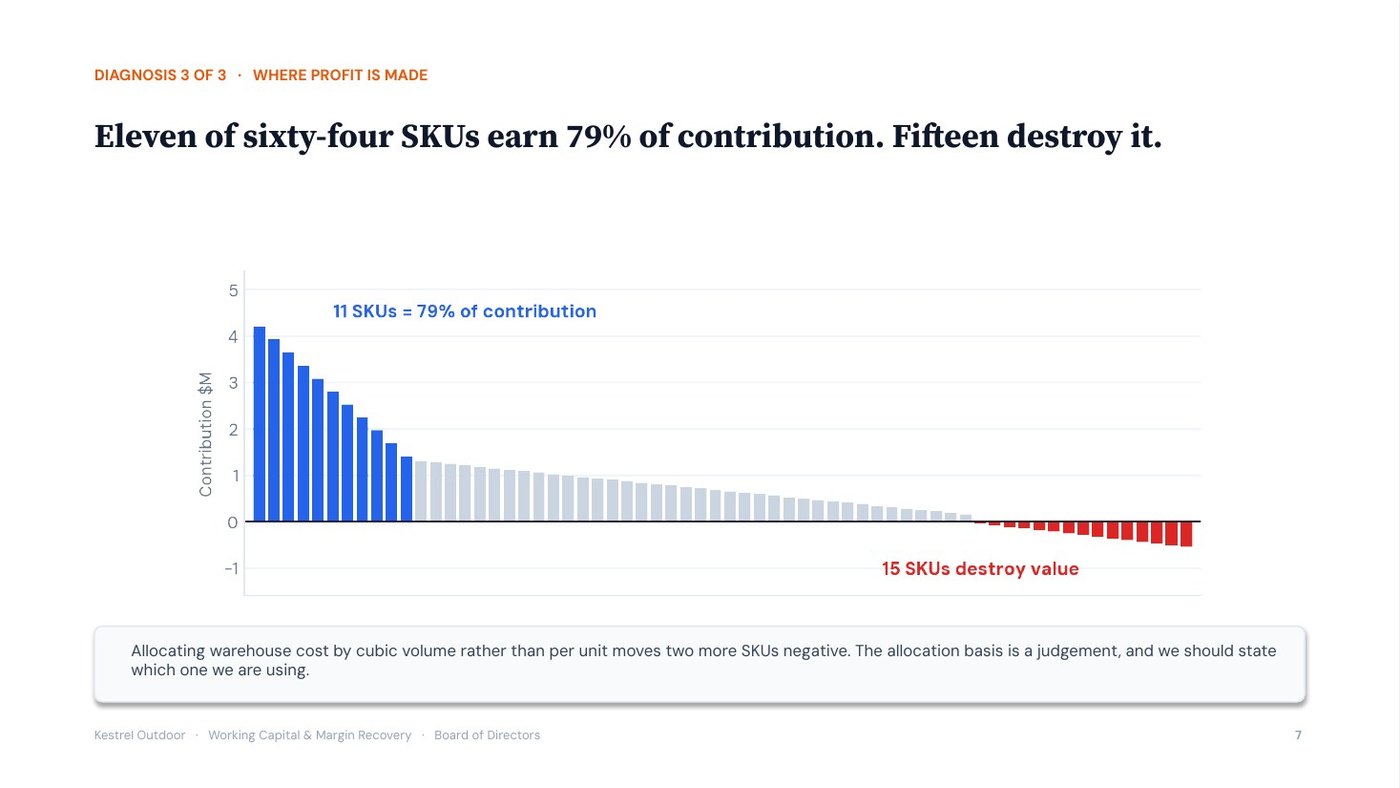
“11 SKUs earn 79% of contribution. 15 destroy it.”

Top 11 SKUs — 79% of contribution
Middle 38 — 21%
Bottom 15 — negative
Operating leverage — 3.4× — both ways
The analysis · 15 of Kestrel’s 64 products lose money

Product profitability analysis ranks each product, or SKU (stock-keeping unit), by the contribution it generates. At Kestrel, 11 products earn 79% of contribution and 15 lose money.

  • Operating leverage: how strongly profit changes when sales change, driven by fixed costs such as rent and salaries. Kestrel’s is 3.4, so a 10% fall in revenue reduces profit by 34%.
  • Cost allocation: the method used to assign shared costs to products. Charging warehouse costs by storage space instead of per unit turns two more products into losses.
  • Diagnosis: the problem is product mix, not pricing.

Takeaway: discontinue or reprice the 15 loss-making products, and state which cost-allocation method the analysis used.

5
Forecast

Driver-Based Revenue Forecast

Builds the forecast from operating drivers instead of last year plus a percentage.

Driver Tree · Assumption Register · Sensitivity
What Kestrel brought · CEO

“Plan says 18% growth next year. Where does that come from?”

What the prompt returned

“Sessions × conversion rate × order value × repeat rate. Conversion decides it.”

Sessions — flat — paid efficiency capped
Conversion — 2.1% → 2.3%
AOV — +4%
Below 1.9% conversion — the forecast stops being credible
The analysis · Kestrel’s 18% growth plan depends on its conversion rate

A driver-based forecast calculates revenue from the operating factors that produce it, instead of adding a growth percentage to last year. Kestrel’s revenue = site sessions × conversion rate × average order value × repeat purchases.

  • Most important driver: the conversion rate. Raising it from 2.1% to 2.4% adds $6.2M over the forecast period.
  • Break point: below 1.9% conversion, the forecast cannot be achieved.
  • Monitoring: acquisition cost, four-week repeat rate and return rate are tracked every month.

Takeaway: set the growth target from a conversion rate the team can realistically achieve, and review the three monitoring measures monthly.

6
Forecast

Three-Statement Model & Integrity Checks

Builds the integrated model — and reports the checks it fails.

Integrated Model · Tie-Out Checks · Excel Build
What Kestrel brought · CFO

“Build me three years, P&L, balance sheet and cash flow.”

What the prompt returned

“FAIL: closing cash is $2.1M below the balance sheet. Here is why.”

Assets = liabilities + equity — PASS
Net income to retained earnings — PASS
Cash flow ties to balance sheet — FAIL −$2.1M
Cause — inventory days 71 assumed vs 118 implied
The analysis · Kestrel’s financial model fails its cash check by $2.1M

A three-statement model links the income statement (profit), the balance sheet (what the company owns and owes) and the cash flow statement (cash in and out). Because the three statements describe the same business, they must reconcile. A mismatch means an assumption is wrong.

  • The failed check: closing cash in the cash flow statement is $2.1M lower than on the balance sheet.
  • The cause: the model assumed stock is held for 71 days, while past results show 118 days.
  • Common practice: many models adjust a figure until the statements match, which hides the error from the board.

Takeaway: correct the inventory-days assumption to match actual results before the model goes to the board.

7
Forecast

13-Week Cash Flow Forecast

Models cash weekly, names the breach, and finds the binding constraint.

13-Week Cash · Cash Conversion Cycle · Layered Diagnosis
What Kestrel brought · CEO

“We have $4.1M. Payroll is the 15th. Are we fine?”

What the prompt returned

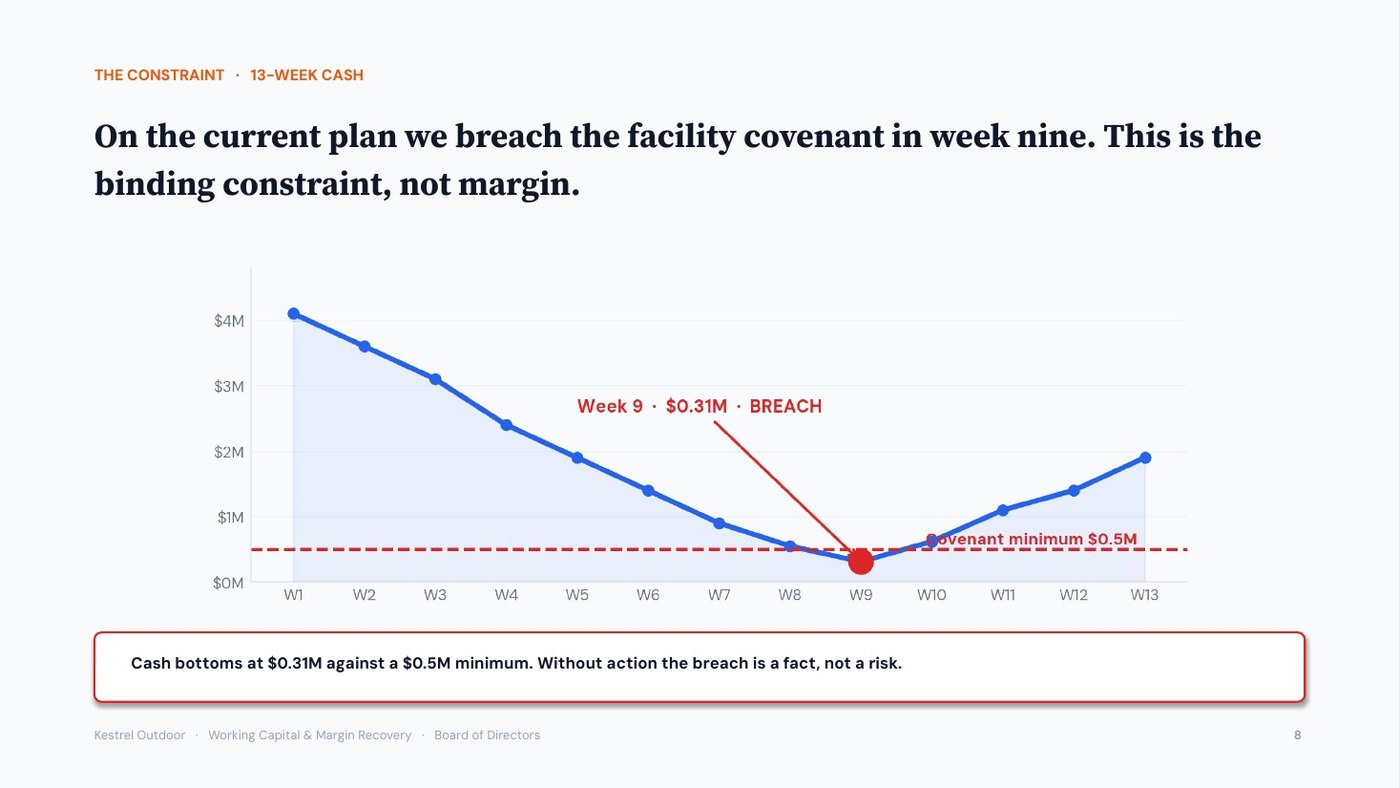
“No. Week 9, $0.31M, against a $0.5M covenant.”

Profitability — not the constraint
Growth drag — not the constraint
Working capital — THE BINDING CONSTRAINT
One day of inventory — about $78K of cash
The analysis · Kestrel is profitable but will breach its loan covenant in week 9

A 13-week cash flow forecast projects cash week by week, because payroll and loan payments fall on specific dates. A covenant is a condition in a loan agreement; Kestrel must keep at least $500K in cash.

  • The breach: cash falls to $310K in week 9, below the $500K minimum.
  • Cash conversion cycle: the number of days cash is tied up in operations. Kestrel pays for stock 118 days before selling it, collects from customers in 4 days and pays suppliers in 38: a cycle of 118 + 4 − 38 = 84 days.
  • Binding constraint: working capital, the cash tied up in stock and receivables. Each day of stock holds about $78K of cash: $48M of revenue at a 59% cost of goods is $28.3M a year, or $78K a day.

Takeaway: reduce inventory days to release cash before week 9. Profitability and growth are not the cause.

8
Decide

Capital Budgeting: NPV, IRR & Payback

Appraises the spend properly — including the option of not spending it.

NPV / IRR / Payback · Do-Nothing Baseline · Breakeven
What Kestrel brought · Head of Operations

“$4.1M for warehouse automation. Finance says it pays back.”

What the prompt returned

“NPV $1.9M at a 12% hurdle. Or $2.6M if you count the unbankable.”

NPV @ 12% — $1.9M
IRR — 19%
Payback — 3.4 years
Excluded as unbankable — “improved customer experience”
The analysis · The warehouse automation project adds $1.9M in value

Capital budgeting evaluates an investment with three measures. Net present value (NPV) is the value of future cash flows in today’s money, minus the investment. Internal rate of return (IRR) is the annual return the investment generates. Payback is the time needed to recover the cost.

  • NPV at 12%: $1.9M. The 12% hurdle rate is the minimum return Kestrel requires from an investment.
  • IRR and payback: an IRR of 19%, above the hurdle rate, and 3.4 years to recover the $4.1M.
  • Excluded benefit: “improved customer experience” was left out because nobody owns or measures it. Including it would raise the NPV to $2.6M.

Takeaway: approve the project on the $1.9M NPV, and track warehouse throughput: the project stays viable while gains reach 71% of plan.

9
Decide

Scenario & Sensitivity Analysis

Finds the value at which the plan stops working — and pre-commits the response.

Tornado · Correlated Scenarios · Decision Triggers
What Kestrel brought · Board member

“Give me a bear case for the recovery plan.”

What the prompt returned

“Below 38.4% gross margin, the fixed-charge cover covenant is breached in month seven.”

Conversion rate — widest spread
Freight — second
Return rate — third
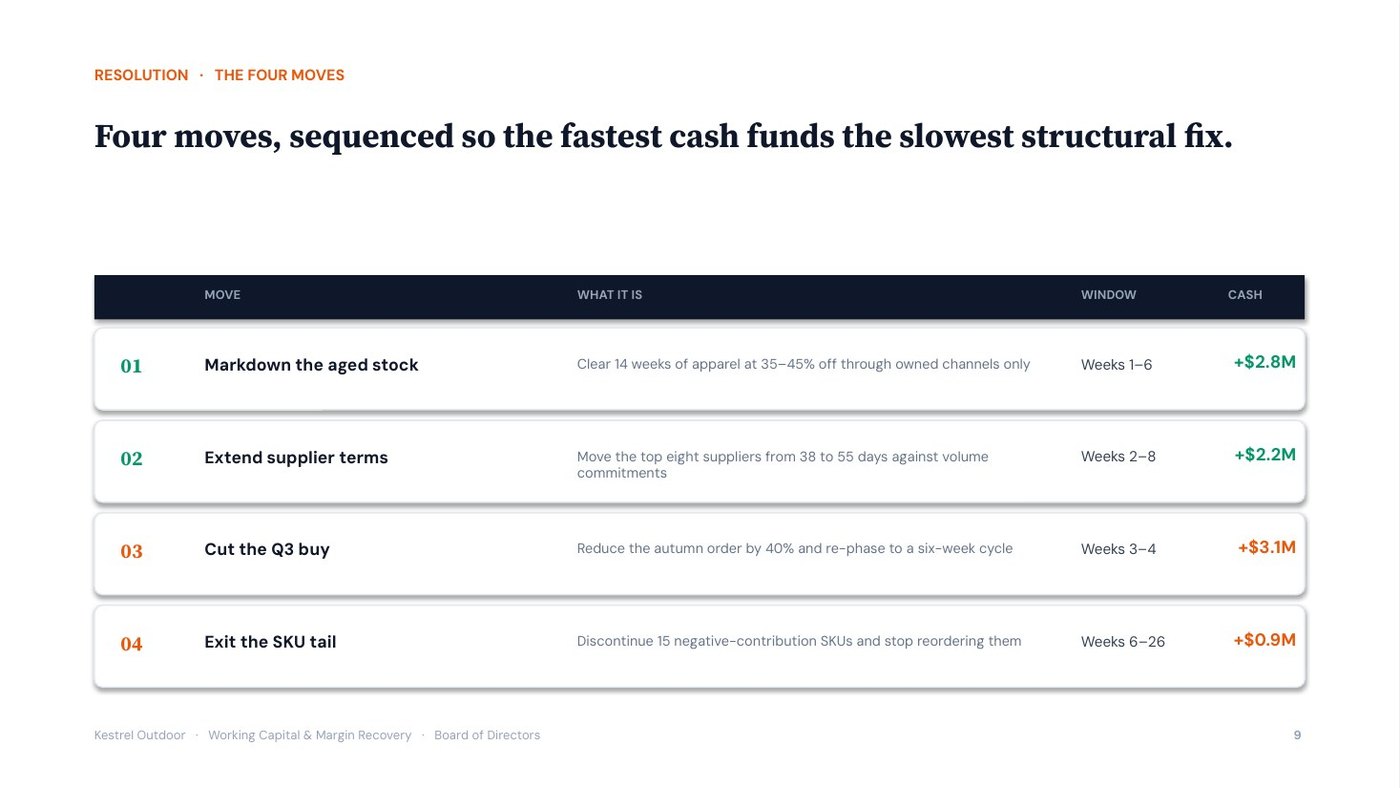
Trigger — if week-4 repeat <18% by March, cut the Q3 buy 40%
The analysis · Kestrel breaches its lending terms if gross margin falls below 38.4%

Sensitivity analysis tests how much the outcome changes when one assumption changes; scenario analysis changes several assumptions together. A tornado chart ranks assumptions by their impact. Kestrel’s largest are conversion rate, freight and return rate.

  • Break point: below 38.4% gross margin, fixed-charge cover falls under the lending agreement’s minimum. Fixed-charge cover is the profit available to pay fixed financing costs, divided by those costs.
  • Realistic downside: the downside scenario models lower sales and higher costs together, not one at a time.
  • Decision trigger: if the four-week repeat rate is below 18% by March, the Q3 stock order is cut by 40%.

Takeaway: agree the trigger and the response now, so the decision is not made under pressure.

10
Communicate

Board Financial Presentation & Q&A

Turns the numbers into the story, the ask, and the questions you will be asked.

Governing Thought · Three Numbers · Ranked Q&A
What Kestrel brought · CFO

“Board is Thursday. I have forty tabs and no narrative.”

What the prompt returned

“A working-capital problem that presents as a margin problem.”

11 weeks — cash runway
41% — gross margin
118 days — inventory
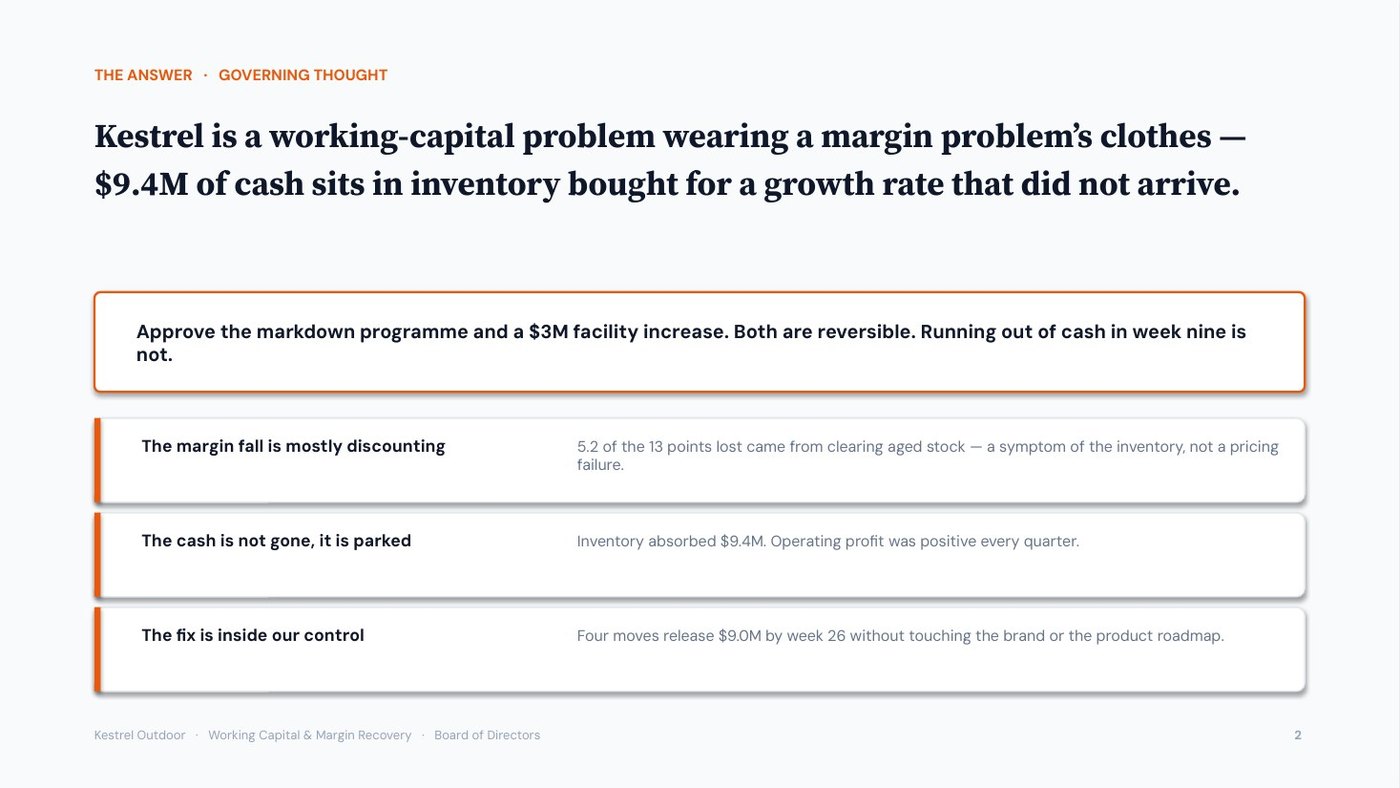
The ask — markdown programme + $3M facility, by 14 March
The analysis · Kestrel’s board presentation leads with one message and three numbers

A governing thought is the single sentence the board should remember from the presentation. For Kestrel: the company has a working-capital problem that presents as a margin problem.

  • Three numbers: 11 weeks of cash, 41% gross margin and 118 days of stock, each shown with a comparison and a trend.
  • The request: a markdown programme to sell excess stock and a $3M credit facility, approved by 14 March.
  • Q&A preparation: seven likely questions ranked by potential damage, starting with the most likely one: why did Kestrel buy so much stock?

Takeaway: open with the governing thought and the request, and prepare the full calculation behind each of the three numbers.

The finale · what prompts 02, 07 and 10 produce

What Kestrel’s board received

Three documents from Kestrel’s Finance Brief: profit by sales channel, the 13-week cash position, and the one-page board summary with the ask.

Two of five channels lose money on every order

Contribution margin by channel: revenue minus the costs each sale causes, after returns

Kestrel Outdoor · for the Head of Growth
Average order value $184
RankChannelContribution margin
1Organic / direct+61%
2Email / CRM+58%
3Retail partners+34%
4Paid social−4%
5Marketplace−11%

Blended

47% contribution: Kestrel keeps $87 on a $184 order. The average hides the two losing channels.

Acquisition cost

$23 per customer through organic search against $124 through paid social. Customer lifetime value is 2.1 times acquisition cost, on a retention rate still to be confirmed.

Kestrel breaches its cash covenant in week 9

13-week cash flow forecast · the loan requires at least $500K in cash at all times

Kestrel Outdoor · for the CEO
Payroll on the 15th

Cash today

$4.1M

Low point, week 9

$310K

against the $500K covenant minimum

Layer testedFinding
ProfitabilityNot the constraint
Growth dragNot the constraint
Working capitalThe binding constraint: stock is held 118 days before it sells
Each day of stock holds about $78K of cash, at cost. Cutting inventory days is the lever that moves the week-9 low point.

A working-capital problem that presents as a margin problem

The one sentence the board should remember, the three numbers behind it, and the ask

Kestrel Outdoor · board, Thursday
Decision by 14 March

Cash runway

11 weeks

Gross margin

41%

Inventory

118 days

The ask. Approve a markdown programme to sell excess stock and a $3M credit facility, by 14 March.
First question the board will ask, prepared. Why did Kestrel buy so much stock? The full calculation sits behind each of the three numbers. Seven likely questions are ranked by the damage each would do if left unanswered.

Prompt output, formatted for this page. The prompts return the same content as text and tables; the figures come from whatever you paste in. Kestrel Outdoor is fictional, so every number here is ours to show you.

Get the Finance & Analysis pack

All 10 prompt templates with full copy-paste text and worked examples — a downloadable PDF plus a plain-text copy file. Lifetime updates.

$15 · 10 prompt templates

Instant download · lifetime updates

Get the pack — $15
Next step · the Presentation Generator

From the Finance Brief to a board deck

The pack ends with the documents above. The McKinsey-Grade PowerPoint Generator is a separate product, $19: paste the Finance Brief into it and it builds a board deck in Claude, as a real .pptx with native, editable charts.

Below is Kestrel’s, twelve slides, unedited.
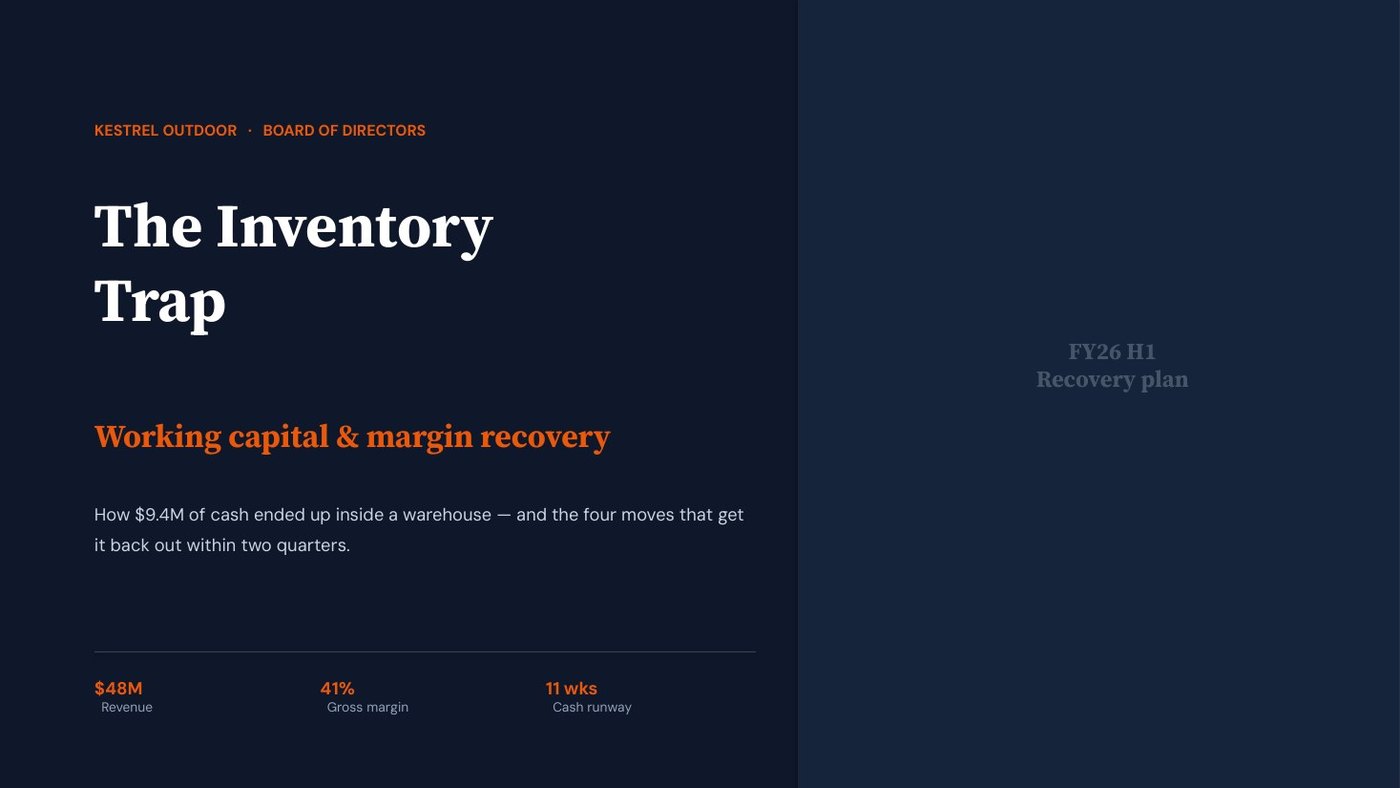
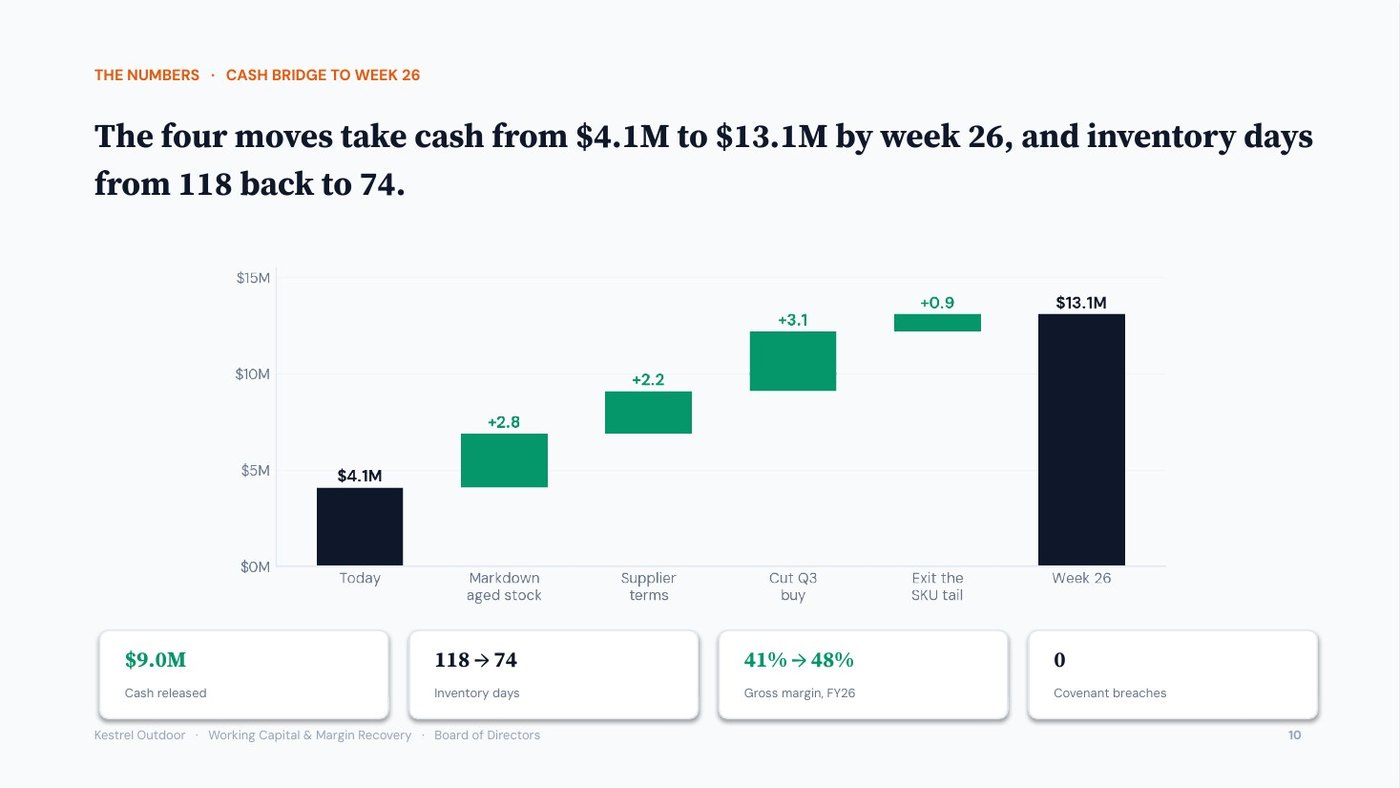
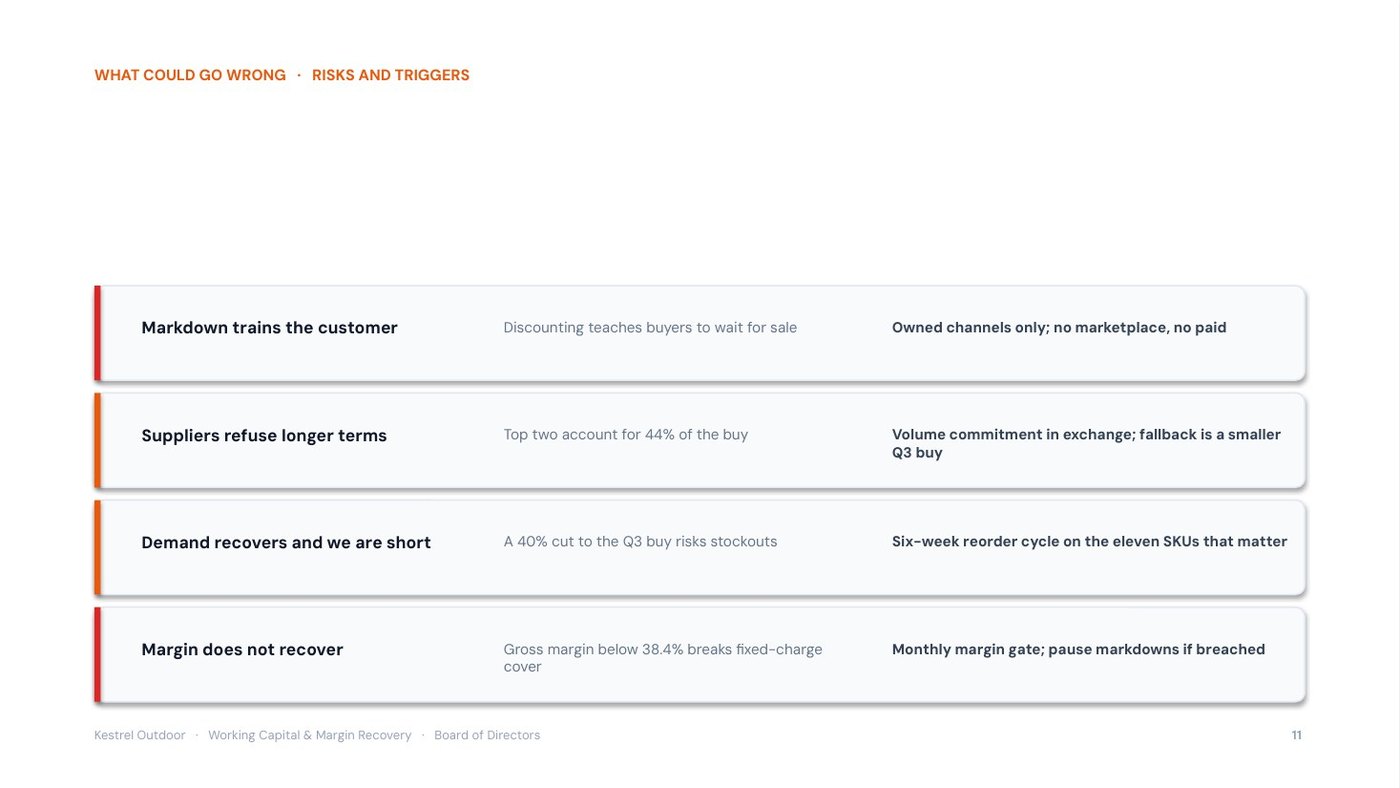
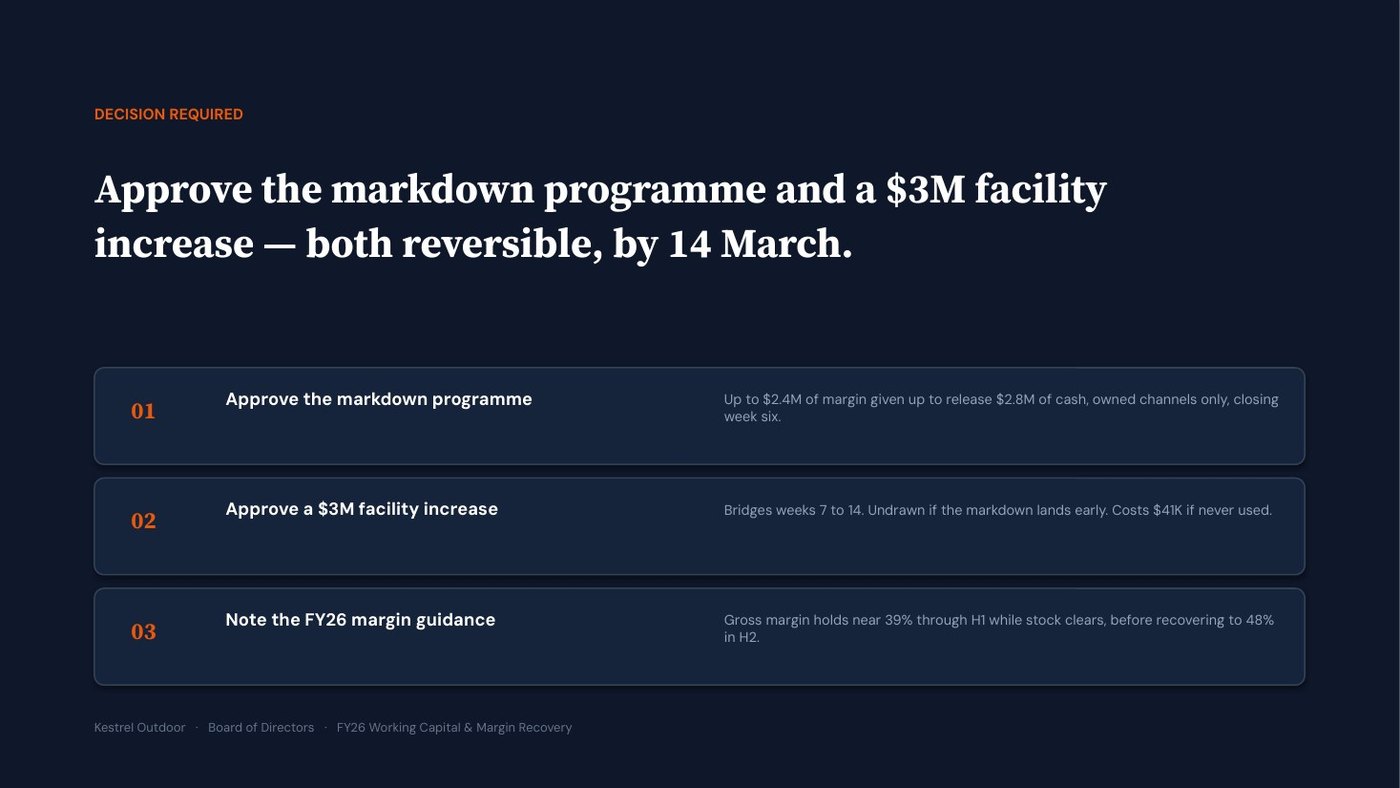
Kestrel Outdoor board deck, slide 1 of 12 Kestrel Outdoor board deck, slide 2 of 12 Kestrel Outdoor board deck, slide 3 of 12 Kestrel Outdoor board deck, slide 4 of 12 Kestrel Outdoor board deck, slide 5 of 12 Kestrel Outdoor board deck, slide 6 of 12 Kestrel Outdoor board deck, slide 7 of 12 Kestrel Outdoor board deck, slide 8 of 12 Kestrel Outdoor board deck, slide 9 of 12 Kestrel Outdoor board deck, slide 10 of 12 Kestrel Outdoor board deck, slide 11 of 12 Kestrel Outdoor board deck, slide 12 of 12
1 / 12

Kestrel Outdoor is a fictional company, so every number here is ours to show you. Generated in the NOVA house style.

Microsoft PowerPoint Want the deck built for you in one shot? The McKinsey-Grade PowerPoint Generator — $19

Built in Claude as a real .pptx with native, editable charts. Or take both generators together in the bundle, $25.

Back to The Prompt Library